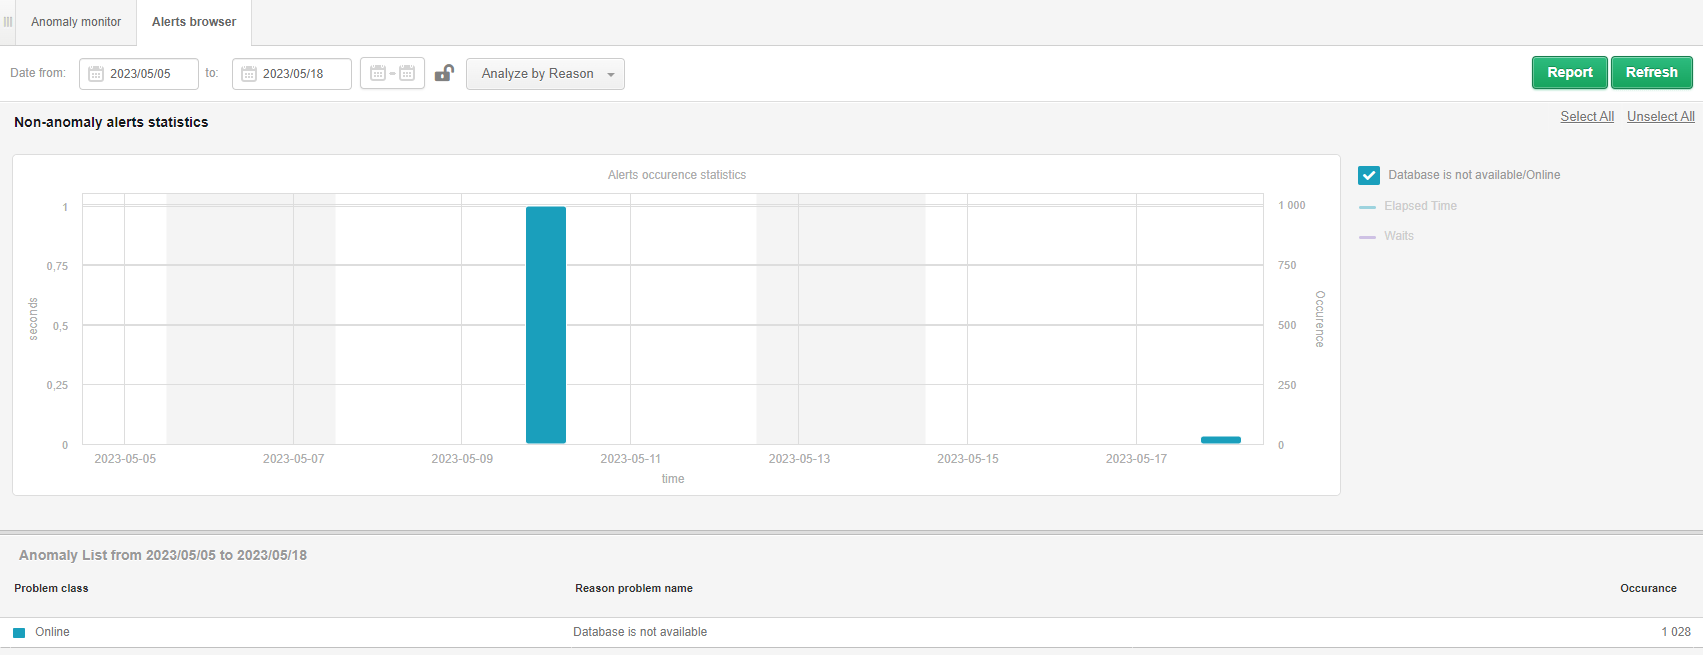
The Alerts browser tab contains information about events not directly related to the performance of queries executed in the SQL instance. The tab presents alerts:
After entering the tab, the alerts are presented in the form of a graph for the last 2 weeks. The height of the bar on the graph corresponds to the number of occurrences of a given problem on a given day. When you click on a point on the graph, you get information on all occurrences of problems on the indicated day.