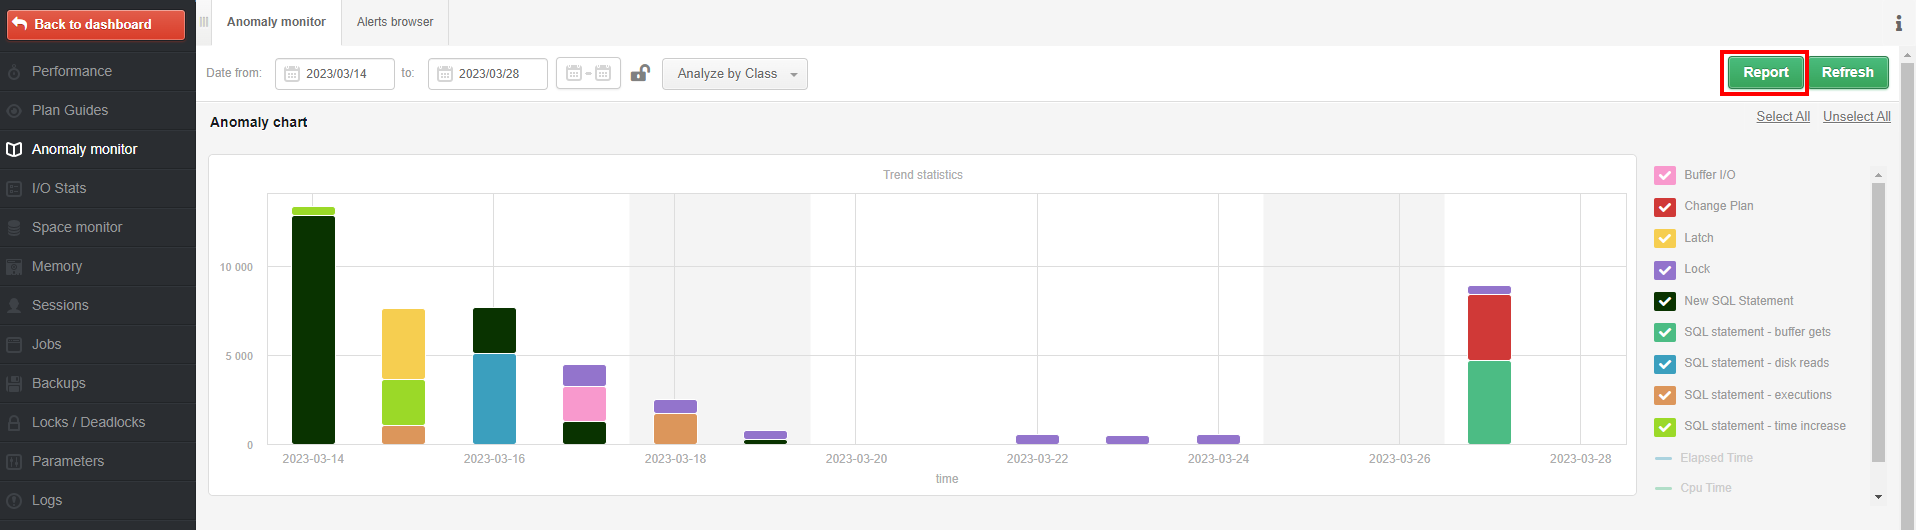
In the application, all performance problems detected by Anomaly Monitor are available for download in the form of a report. The report contains basic information about the performance of the monitored instance. The report is available in *docx format and is generated on the Anomaly monitor page after clicking [Report].
In order to generate the report, first select the language in which the report will be generated as well as the date range in which the performance problems occurred.
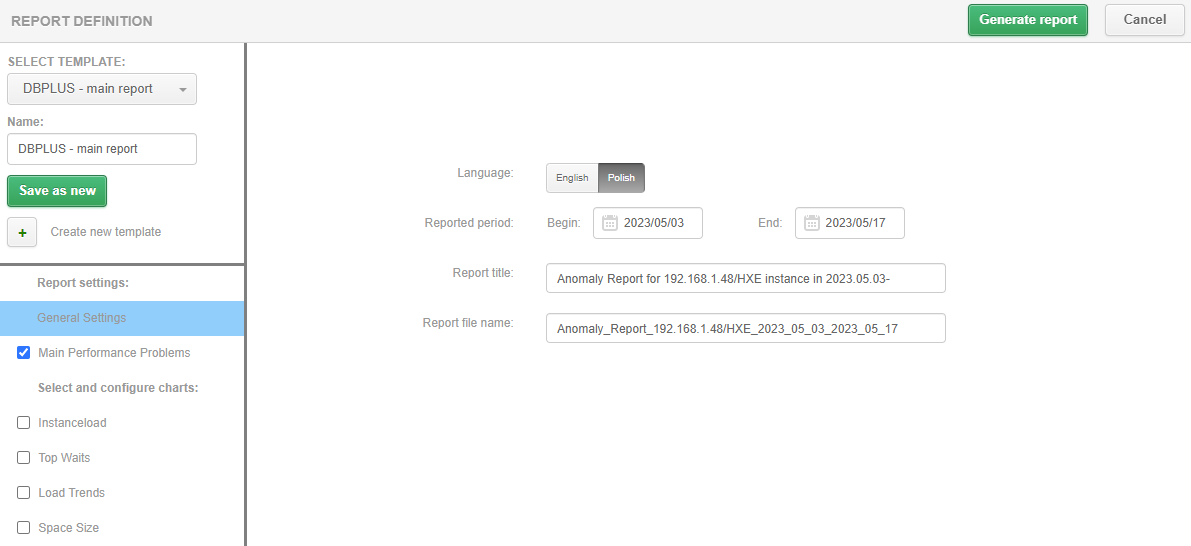
In the Main Performance Problem menu, the user can change the predefined settings for which the report is generated.
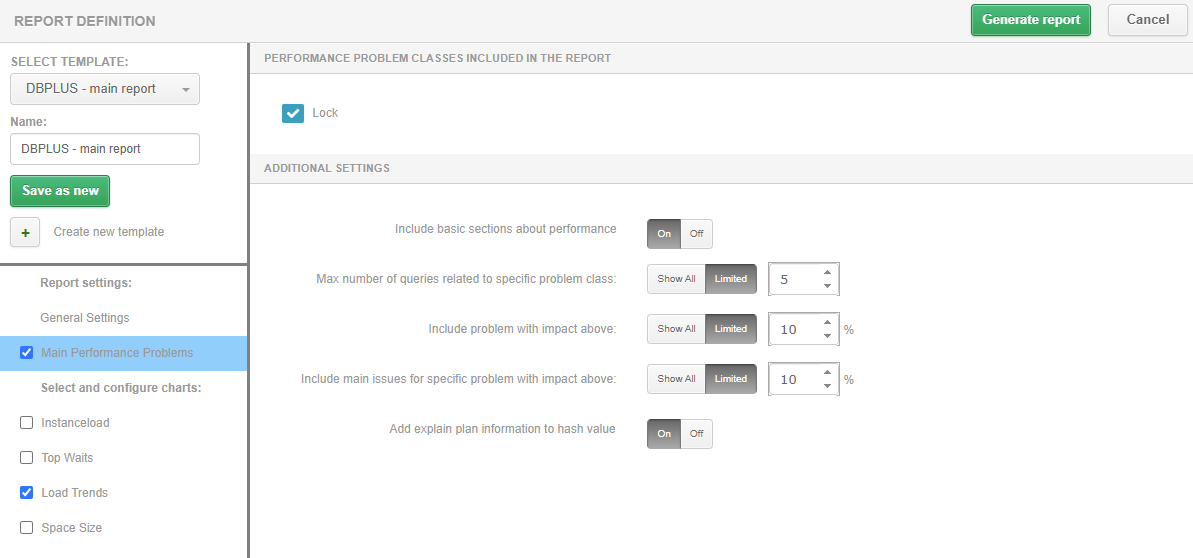
PERFORMANCE PROBLEM CLASSES INCLUDED IN THE REPORT
The section contains problems which were detected by the application in the indicated period. Unchecking the checkbox for a given problem will result in it not being included in the generated report.
ADDITIONAL SETTINGS
Contains a list of additional settings that affect the content of the Anomaly report.
Include basic sections about performance - is responsible for visibility in the report of basic information about the performance of the instance.
Max number of queries related to specific problem class - for performance problems, the report includes information about the queries related to the problem. By default, for each problem related are 5 queries that had the greatest impact on the height of the problem, or those that slowed down the most as a result of the problem (e.g. Problem of locks).
Include problem with impact above - in the report will be described in detail only those problems which accounted for a minimum of 10% (default value) impact on performance in relation to the other detected problems.
Include main issues for specific problem with impact above - this parameter is responsible for adding to the description of the event which accounted for a minimum of 10% (default value) of the impact for a given class of problem.
Add explain plan information to query hash - this parameter is responsible for adding an execution plan to each query that has been associated with a particular problem.
The report is generated from a template that has been predefined by DBPLUS analysts. If you need to change the settings and periodically generate a report with different settings, you have the option to create a template and save it for reuse when generating the report.
ADDITIONAL CHARTS
The user also has the option to add charts that are not included in the Anomaly Monitor report by default. To do this, you need to check the box for the chart and then configure the series to be displayed on the chart.