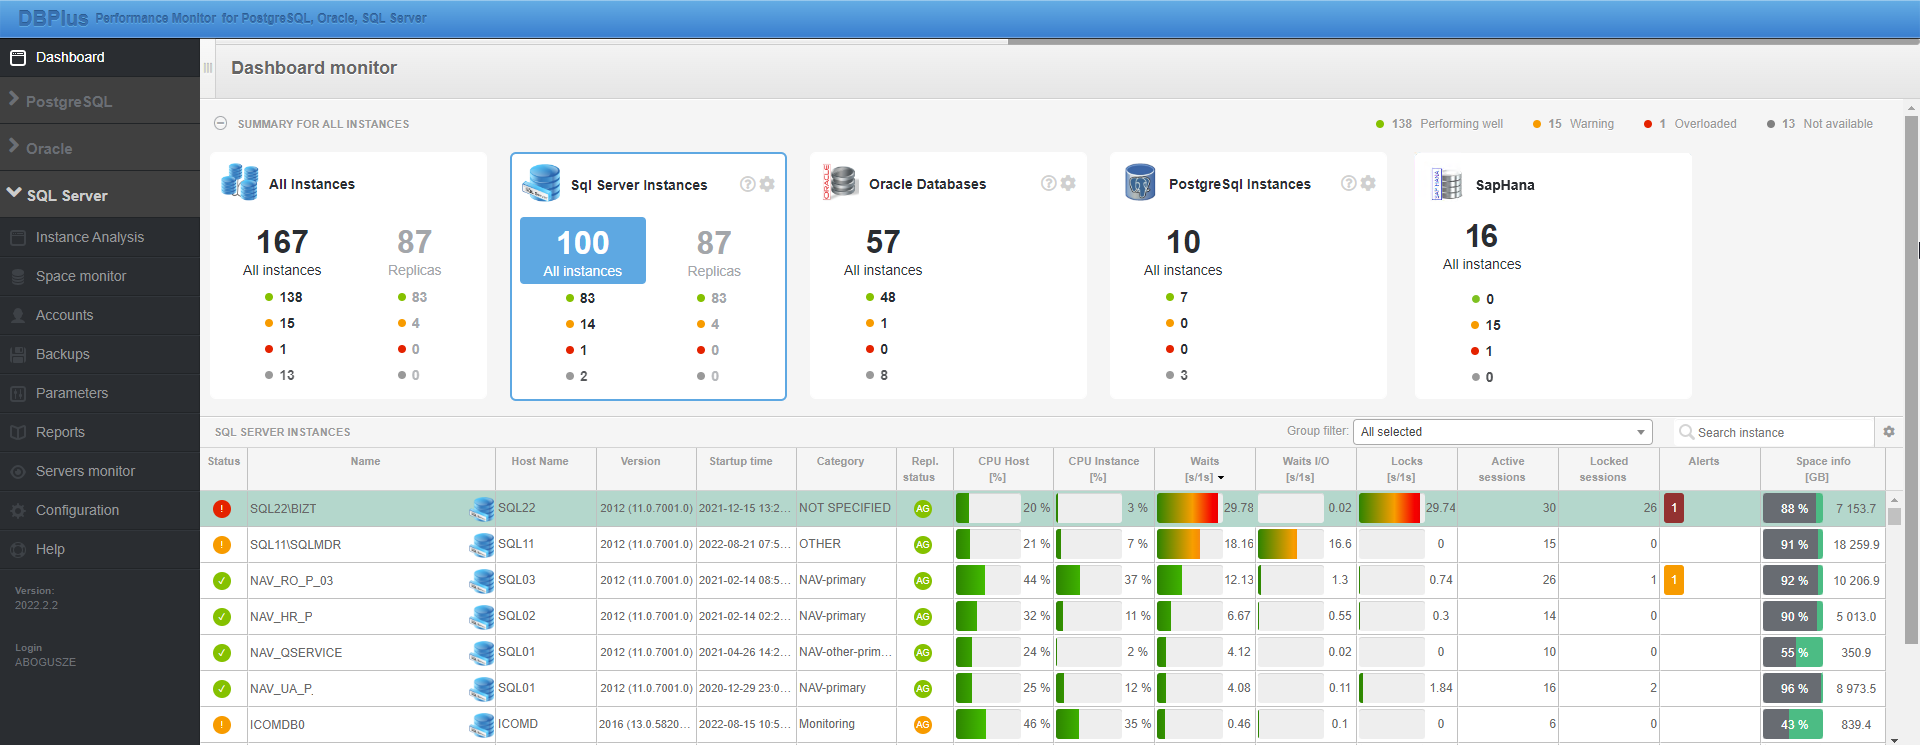
The Dashboard screen shows basic performance statistics for each of the monitored database platforms. The user can toggle the list of monitored instances by clicking on individual “tiles” in the SUMMARY FOR ALL INSTANCES area. Depending on the selected option, it is possible to view all platforms or a selected database platform. Below the summary are tables containing basic data about each monitored instance. The data on the screen is refreshed automatically every 30 seconds.
SUMMARY FOR ALL INSTANCES
The summary area contains information about the number of instances connected to the monitoring. Each tile presents databases whose data are stored in separate repositories. The user has the option to present all databases together All Instances, as well as each platform separately. The view is changed by clicking on an individual tile, which is highlighted in blue. Information about the status of the monitored databases is available in the summary in two options:
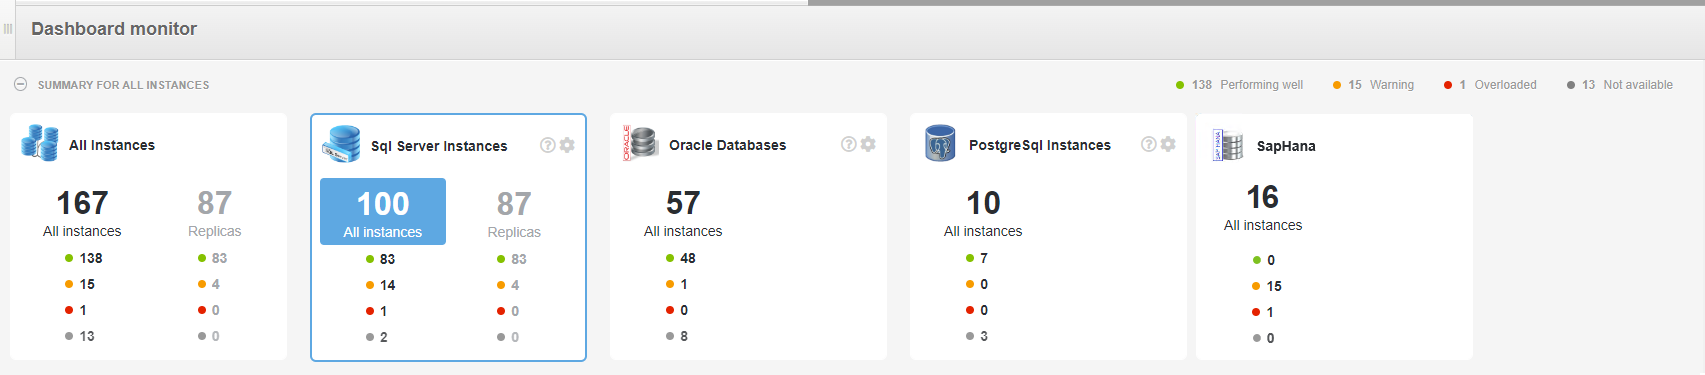
This view allows you to filter databases as needed, both by status and also you can easily filter the group of databases for which the Standby database is configured (by indicating the Replicas part).

This view is available by clicking the [minus] icon in the SUMMARY FOR ALL INSTANCES bar. It only contains information about the number of databases in a particular and group and allows easy navigation between them.
SERVERS AND DATABASES area
This area contains basic information about the monitored databases. The view can be filtered using pre-assigned groups for each instance - Group filter, as well as by typing the instance name in the Search instance field.
On the screen it is possible to track performance for all monitored instances. If the alarm threshold of any statistic is exceeded, the status for the instance will be changed to orange (Warning) or red (Critical). The user has the ability to verify which statistic for a given instance was exceeded. This can be checked by moving the cursor over the Status column.
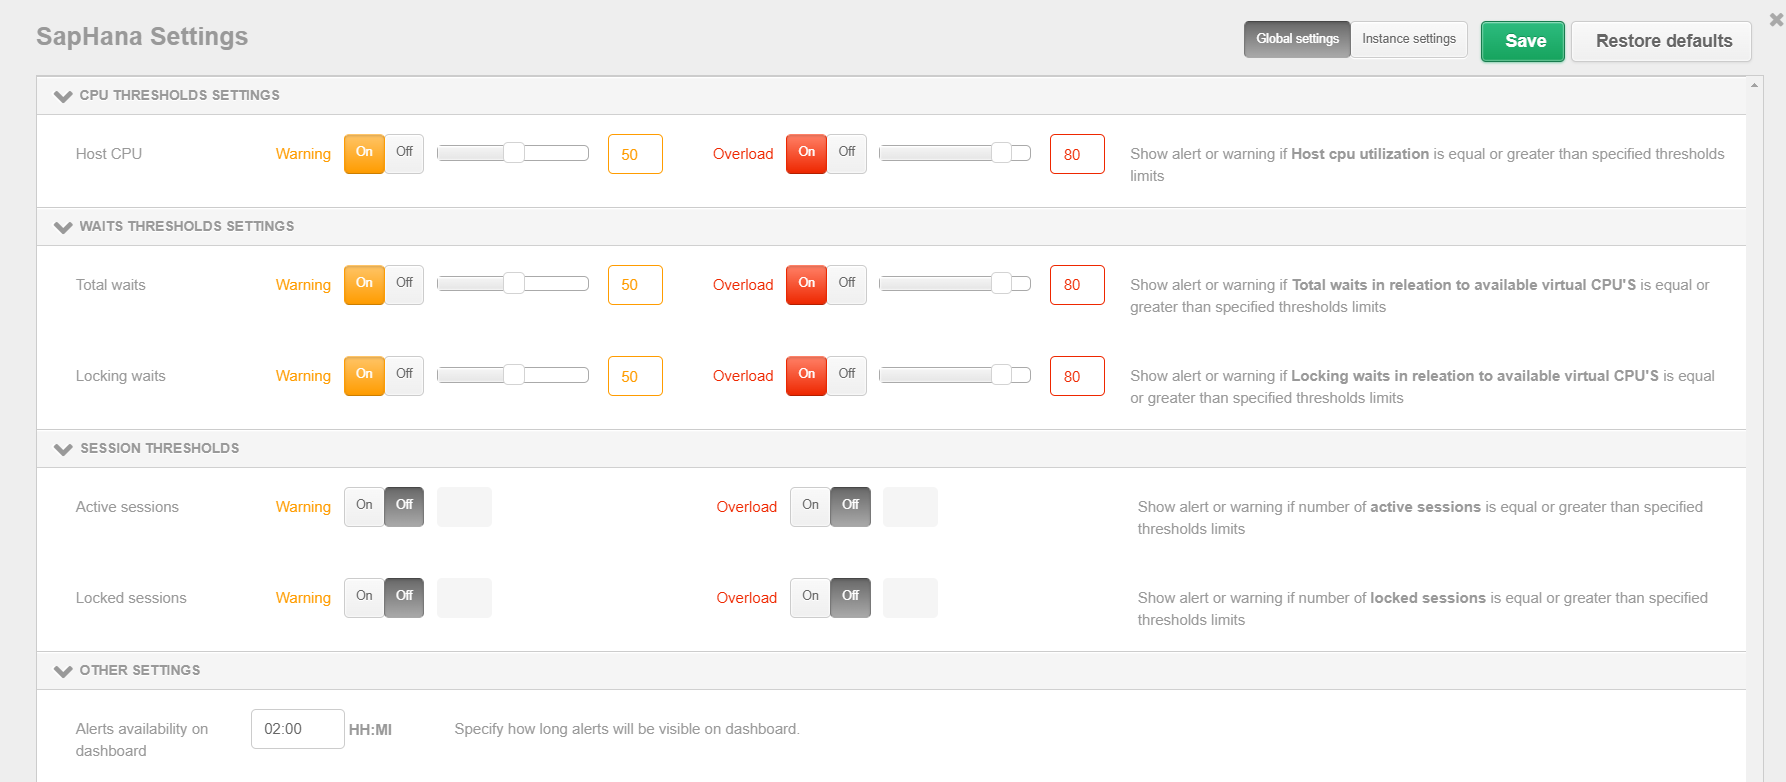
The alarm threshold value for a particular statistic depends on the settings. After installing
the application the thresholds for the most important statistics are predefined. The user can
change the thresholds by going to the settings menu and clicking on the [cog] icon for a given
database platform. Changes can be made for all databases simultaneously
Global settings or by selecting a specific database instance from the list
Instance settings Settings are also available from the main settings
Dashboard thresholds.
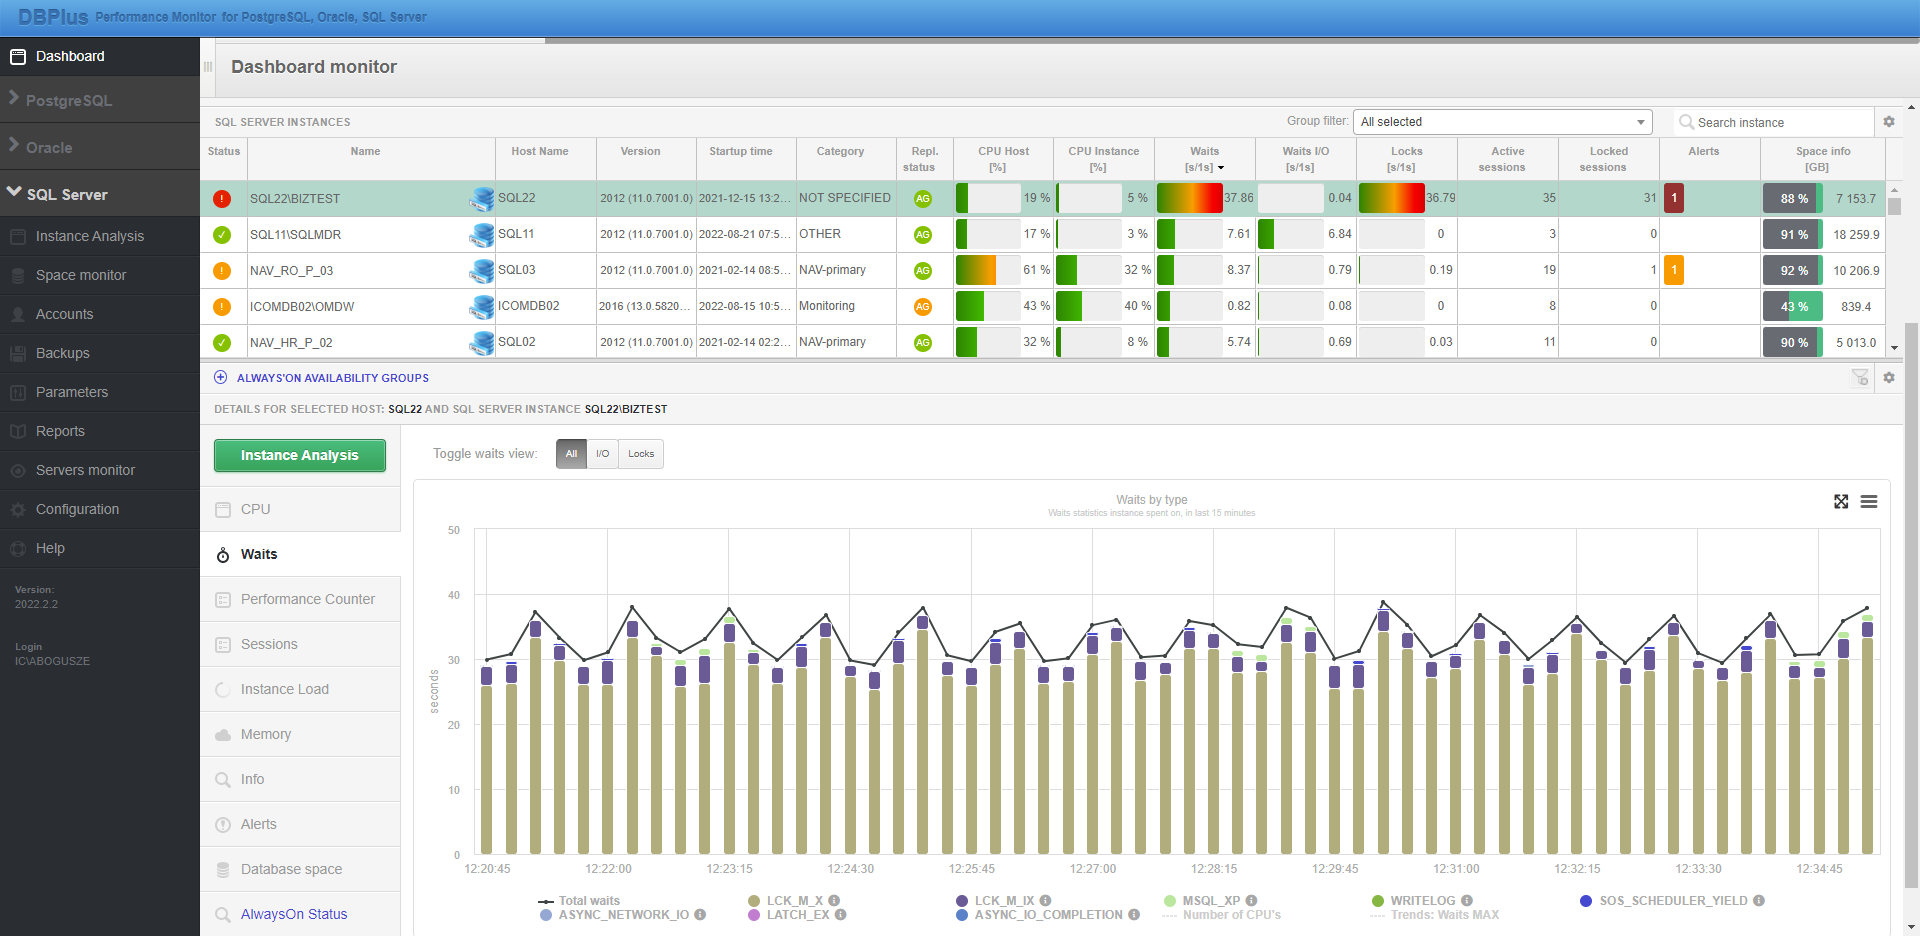
Instance performance details
This area contains data about the most important performance statistics for the monitored database. By clicking on a value in the table at the instance area level, the user gets detailed information about a given statistic at the instance details level.
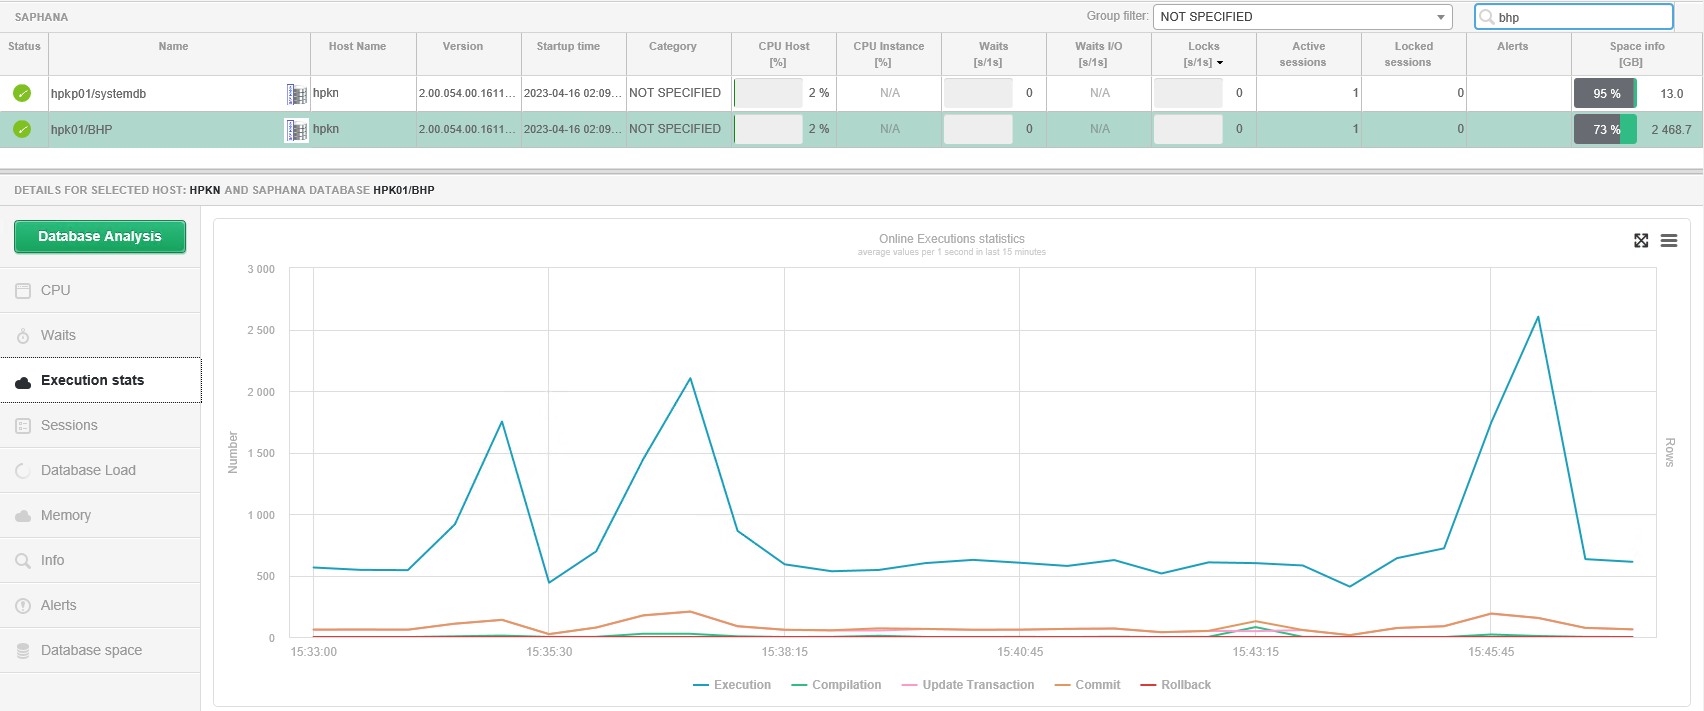
In addition, the area includes the ability to quickly verify the performance of the instance: