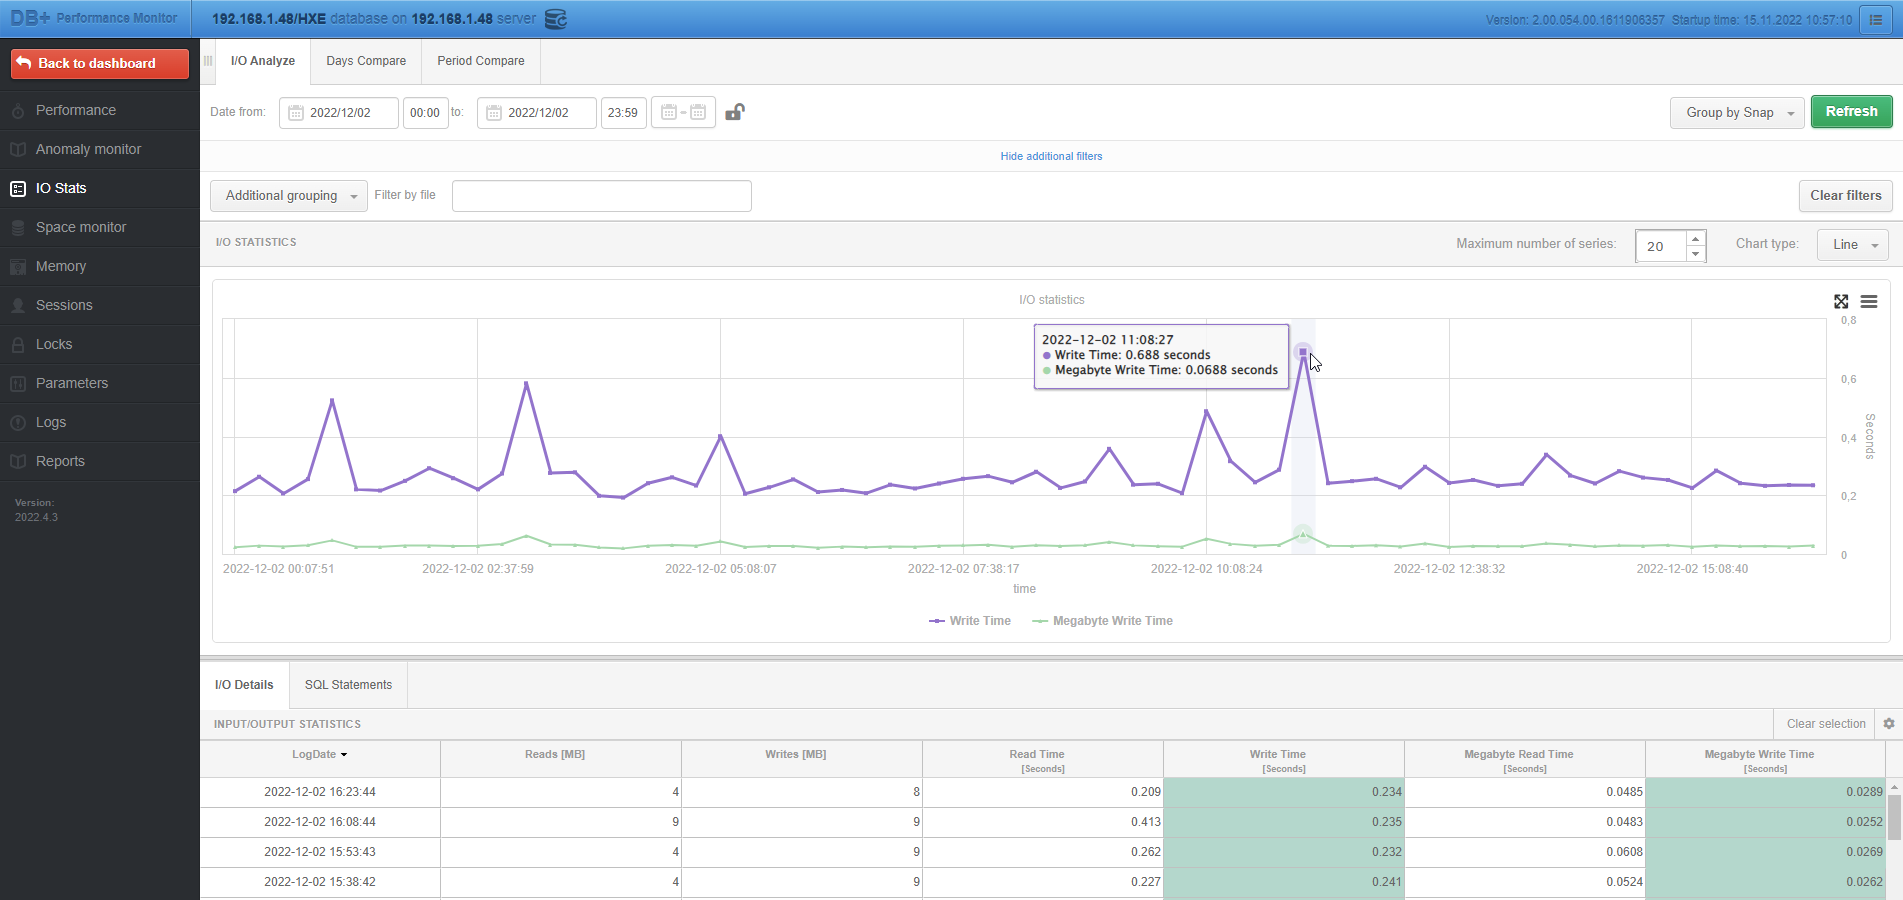
The screen provides information about the performance of disk devices of the monitored database. The statistics are displayed by pointing to the data column in the table below the graph.
In addition, the option Show additional filters allows you to verify the statistics for a given file name.
Statistics are always presented for the selected time period. We also have the ability to group the displayed statistics by:
The No group by period option presents summary statistics for the entire selected period.
In some cases, in order to better verify the performance of disk devices, there is a need to hide points on the graph that hinder analysis. On the chart, we have the ability to hide points by simultaneously holding down the [Ctrl] key and indicating the point to be removed. The points can be restored to the chart again by clicking on the [Refresh] button.Important
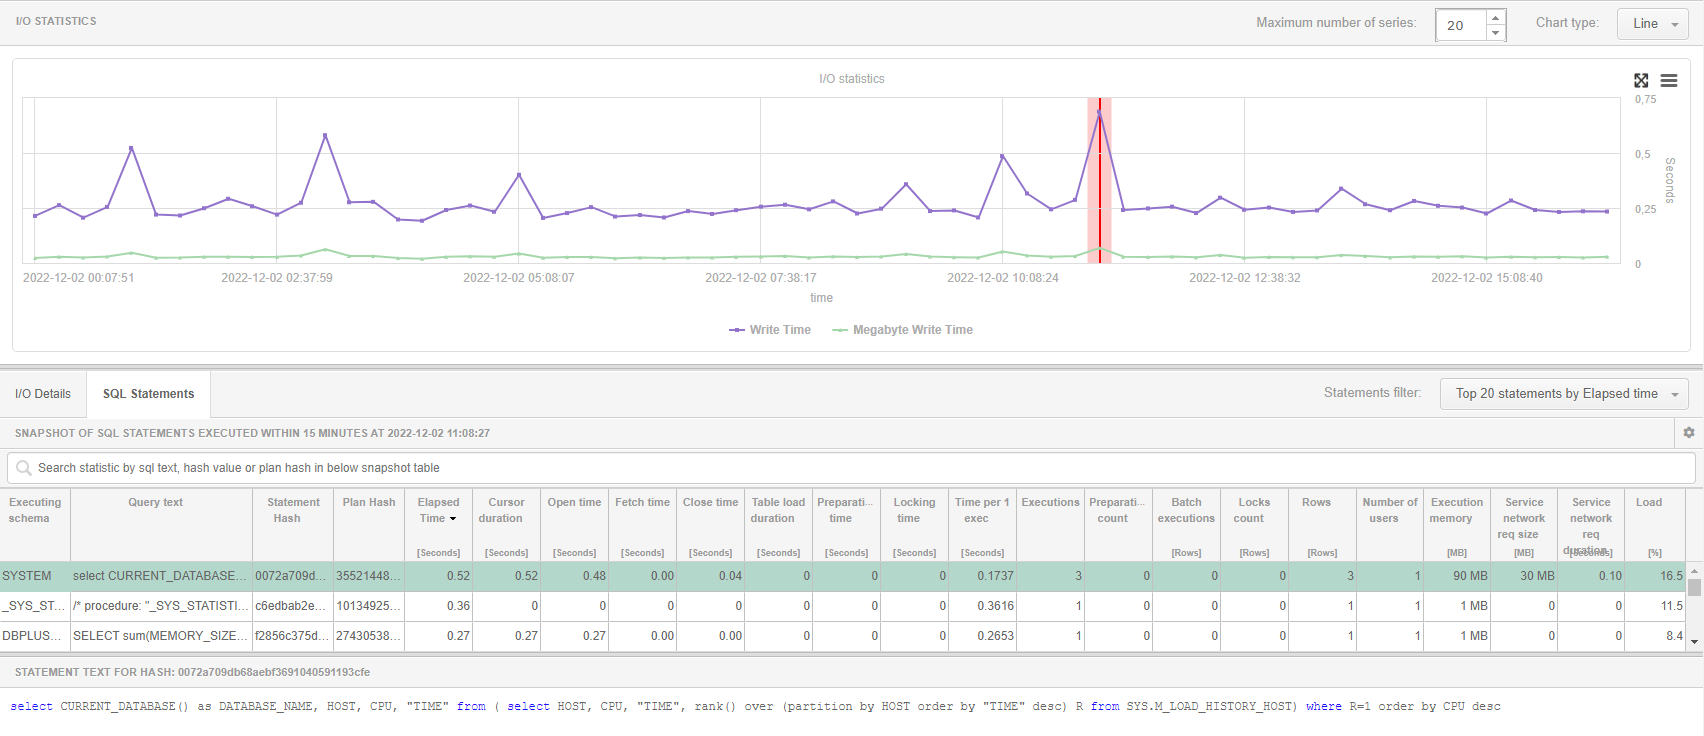
SQL Statements.
This tab allows you to see what queries were run on the instance at a specific point in time. Pointing to a point of interest on the chart will present the queries. We can freely sort the information about the queries by each of the columns containing statistics.