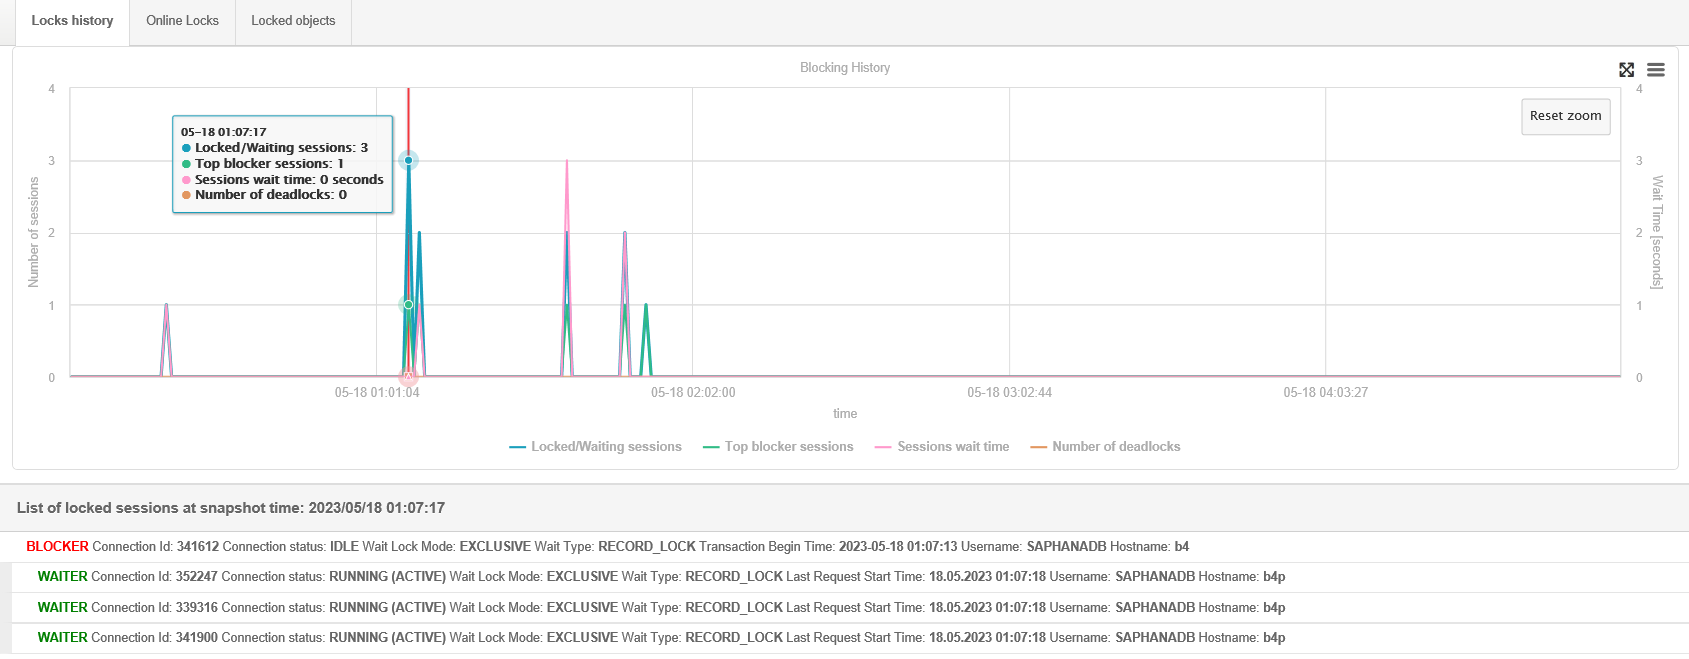
The tab allows you to analyze the locks that occurred in the monitored database during the
studied period.
Information about the occurrence of locks is presented in the form of a graph. The graph can be freely increased, by selecting a given section with the mouse cursor. Clicking on a given point on the graph displays a list of sessions participating in the blockade for that point in time. Blocks are displayed below the chart as a list in the form of a tree, where:

Selecting a session displays the content of the query that was currently being executed by the session, as well as the session details.
Information about the query ID is available in the session details. After expanding the
dedicated menu with the [+] button, we have the ability to go to the details
of a given query View sql details, as well as we can verify the session
history for the query View session history.