In this tab we can configure the general parameters of the alert module. The parameters are
divided into areas:
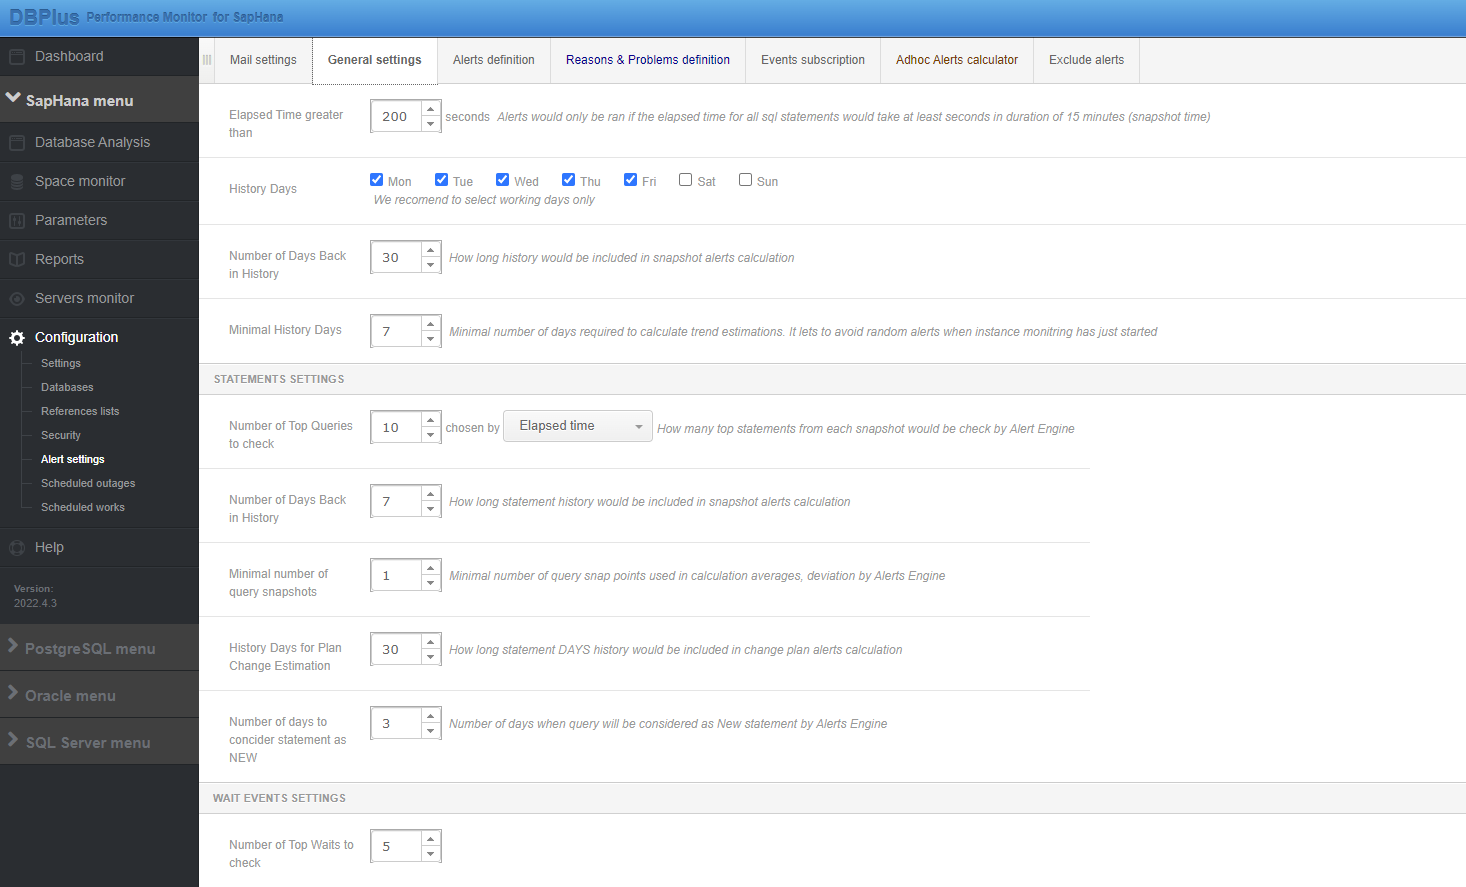
General Parameters
-
Elapsed Time greater than - alerts will be calculated when in a given snap
the duration of all queries together exceeds 400 seconds.
-
History Days - specify the days of the week that will be taken into account
when examining the trend for performance problems.
-
Number of Days Back in History - the number of days in history based on
which the application calculates performance trends of the monitored instance.
-
Minimal History Days - specifies the minimum time after which trend-based
alerts will be calculated
Statements Settings - parameters concerning queries.
-
Number of Top Queries to check - the number of top queries per snap that
will be examined for performance issues, Chosen by Elapsed Time/CPU Time -
selection according to which statistic Elapsed Time or CPU Time queries will be selected.
-
Number of Days Back in History - the number of historical days based on
which the system will analyze the performance of the top queries on the current day.
-
Minimal number of query snapshots - the number of snapshots needed to
calculate the average deviation of a given statistic in a query.
-
History Days for Plan Change Estimation - the number of days in history
taken into account for calculating the change in execution plan.
-
Number of days to concider statement as NEW - number of days for which the
query will be treated as new
Wait Events Settings - parameters regarding waits.
-
Number of Top Waits to check - used to handle waits calculated based on the
trend. The number of top waits is taken into account for the calculation depending on this
parameter.
-
Number of Days Back in History - how many days back is taken into account
for history calculation
After making changes to the parameter settings on the page, it is required to save the changes
using the [Save settings] button.