The module allows you to analyze and compare with each other the main performance statistics over a long period of time. Information on statistics is collected from the first snapshot after connecting the monitoring database. Thanks to Load Trends we have the opportunity to verify whether the work on improving performance brings the expected result through the presentation of performance from the moment of connecting the instance to monitoring.
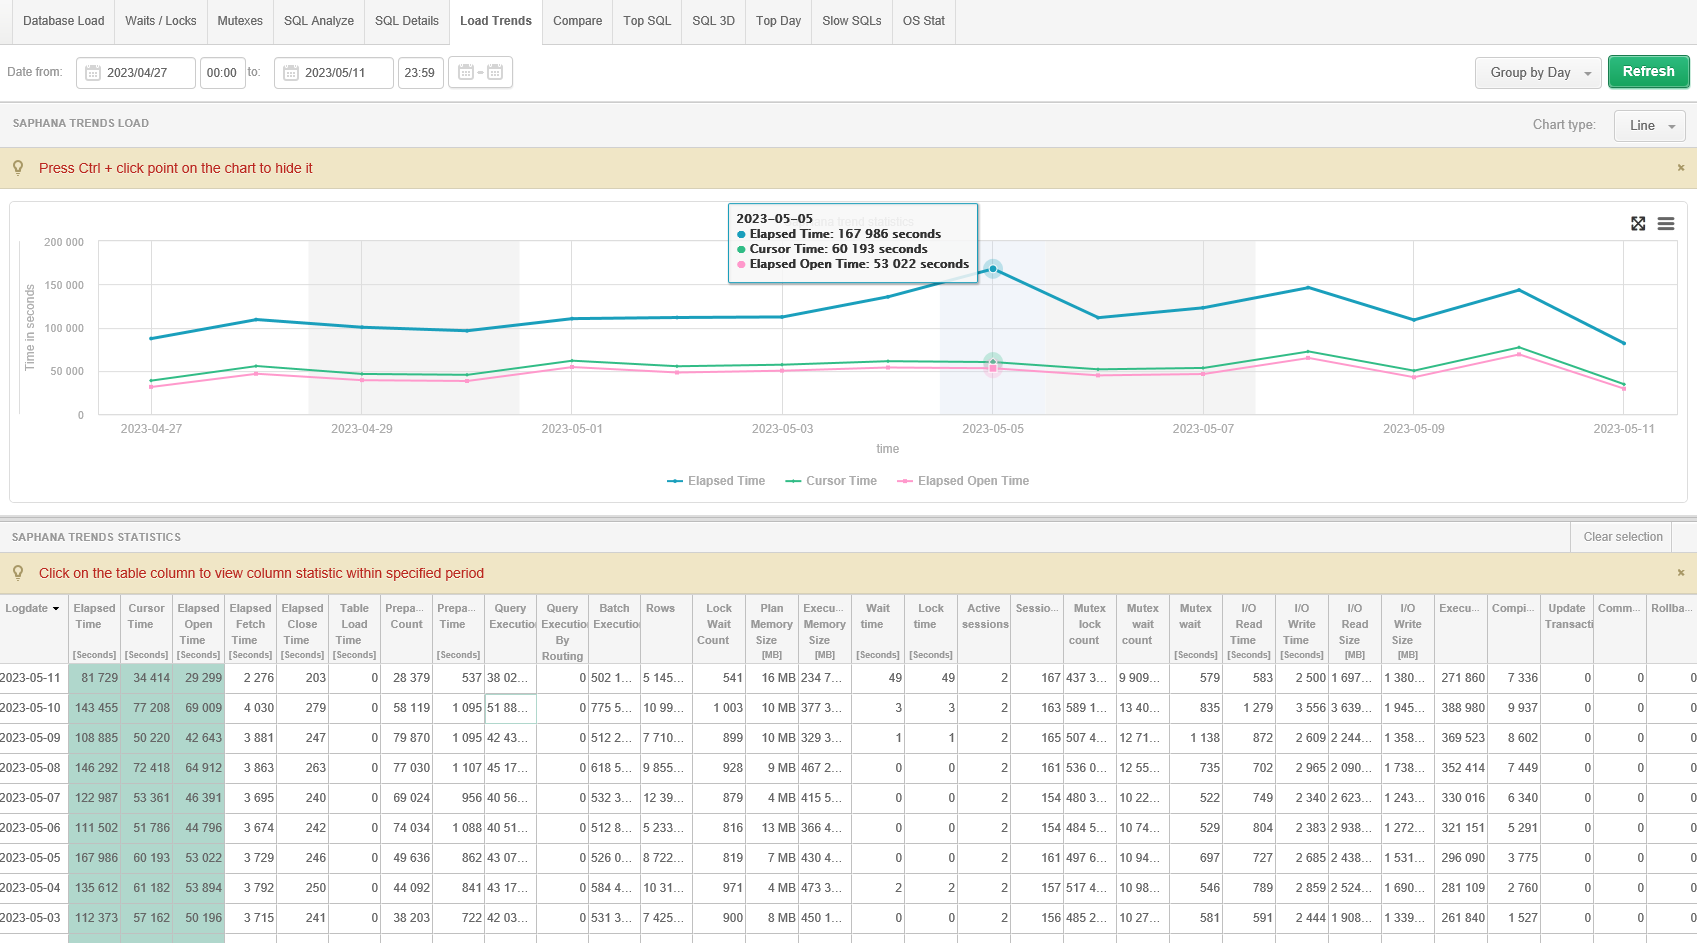
In order to present data on the chart, click on the data area for the selected statistic. As a result, the data for the selected period will be presented on the graph. We can display many statistics simultaneously on the chart.
Statistics are always presented for the selected time period. We also have the ability to group the displayed statistics by:
The option No group by period allows you to display summarized all stats for whole selected time period.
In some cases, in order to better diagnose the performance trend, there is a need to hide points on the graph that hinder the analysis. On the chart, we have the ability to hide points by simultaneously holding the [Ctrl] key and indicating the point to be removed. The points can be restored to the chart again by clicking on the [Refresh] button.Important