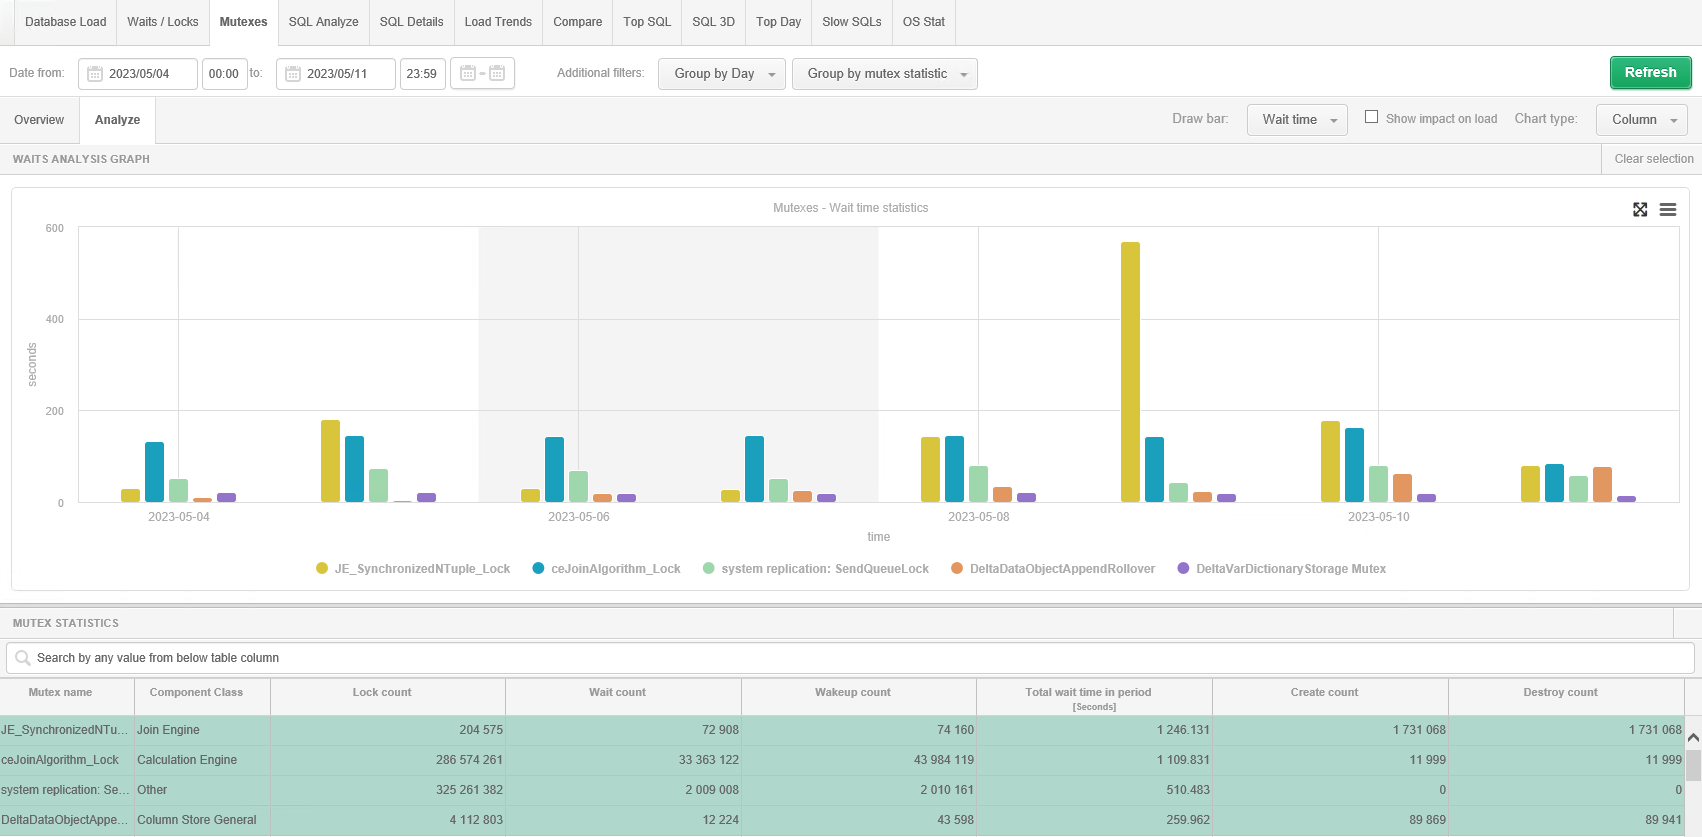
On the screen, the user can analyze mutexes (ang. mutual exlusion) in the monitored database. Graph presentation is available using grouping by day, hour, snap (15 minutes). Example of analysis result presented below:
Series are added to the chart by selecting the desired row(s) in the table below the chart.
The table shows the mutex name, class and basic statistics.
On the page, we have the option to present each statistic for the selected set of mutexes on
the graph by changing the statistic available in the Draw bar option.
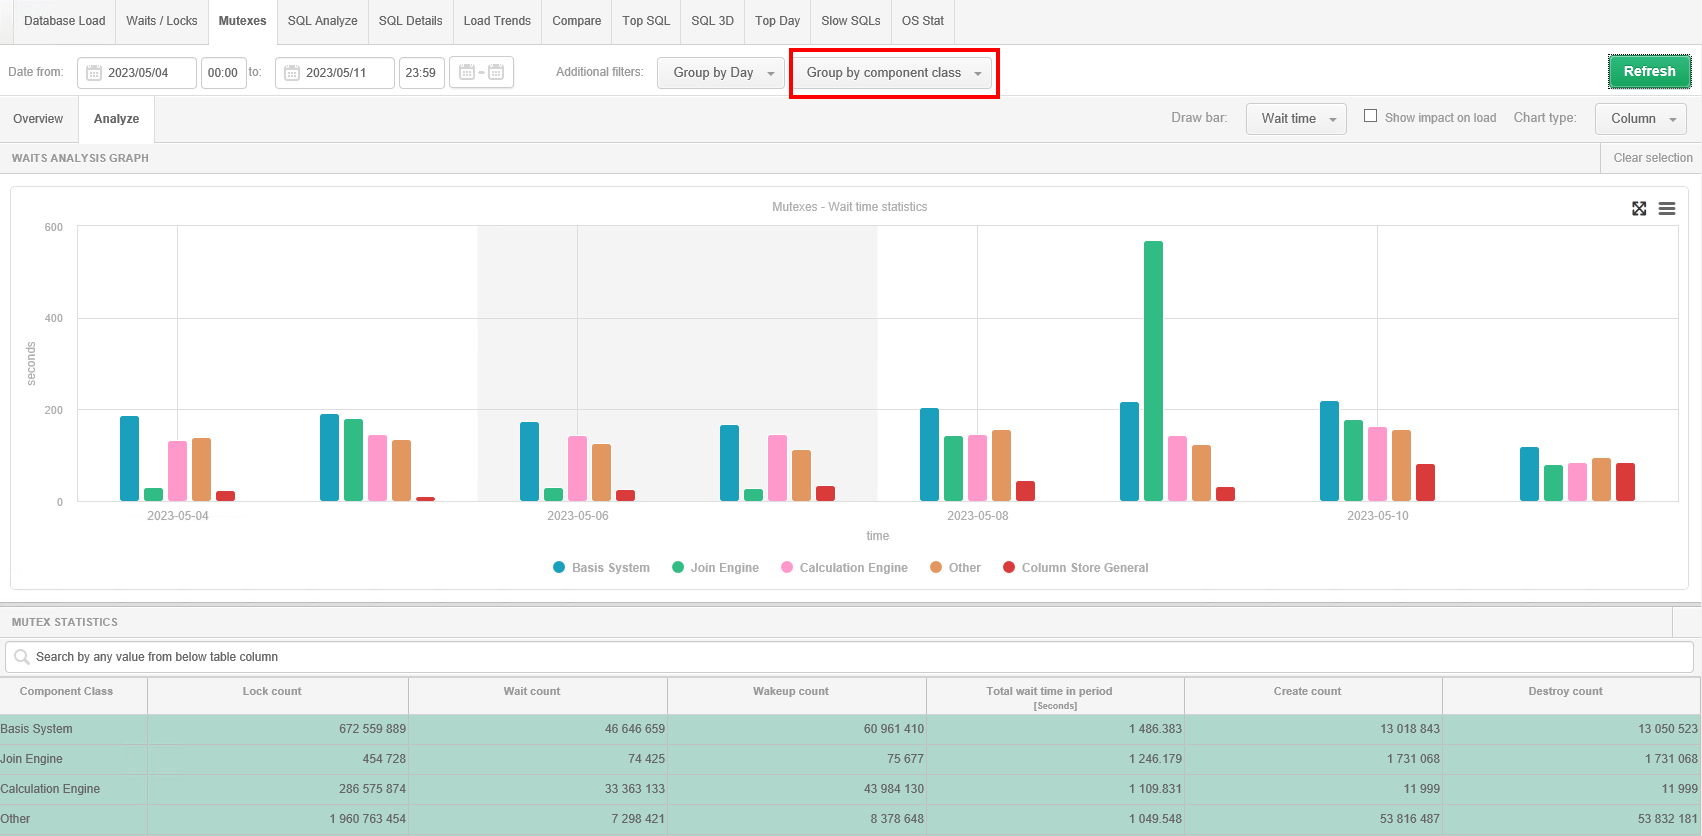
Grouping by mutex class
Depending on the period that has been selected, it is possible to display on the graph what is
the share of a given mutex class (option Group by componnent class) in the
total number of mutexes.
The Show impact on load option allows you to determine the share of analyzed
mutexes in relation to all in a given time period.