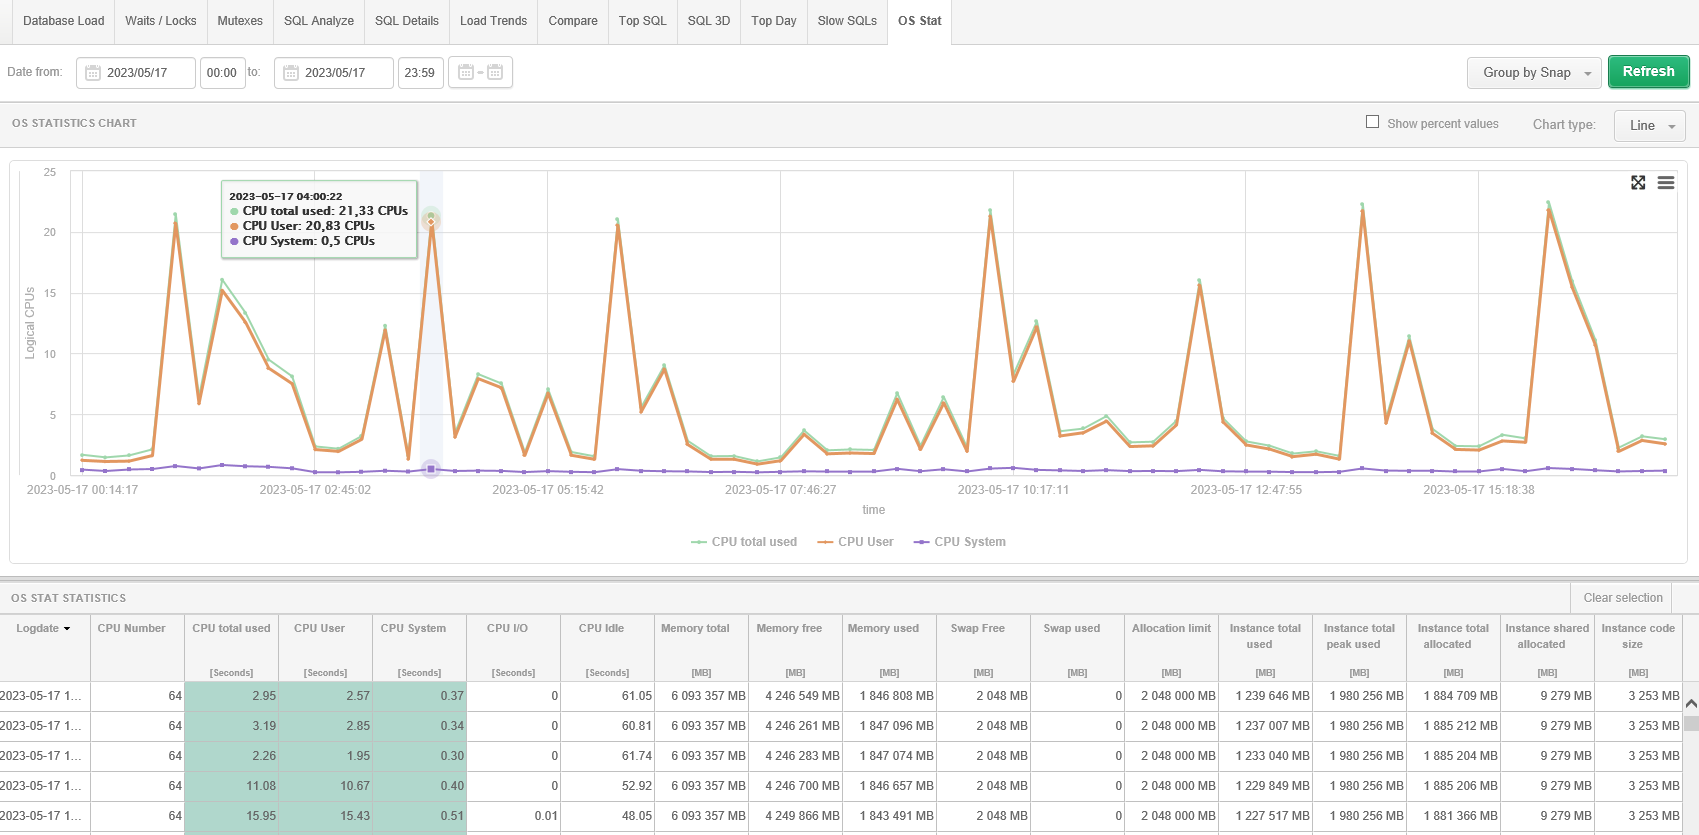
The module presents information on statistics collected from the operating system level. On the page we can verify both the level of CPU utilization on the database server and the level of memory utilization by database instances. The statistics we are interested in are added to the chart by clicking on the data for a given statistic in the table area.
The Show percent values option converts the data, into percentages which can then be displayed and juxtaposed with each other on a graph.
Statistics are always presented for the selected period of time. We also have the ability to group the displayed statistics by:
In some cases, for better verification, there is a need to hide points on the chart that hinder the analysis. On the chart, we have the ability to hide points by holding the [Ctrl] key simultaneously and indicating the point to be removed. The points can be restored to the chart again by clicking on the [Refresh] button.Important