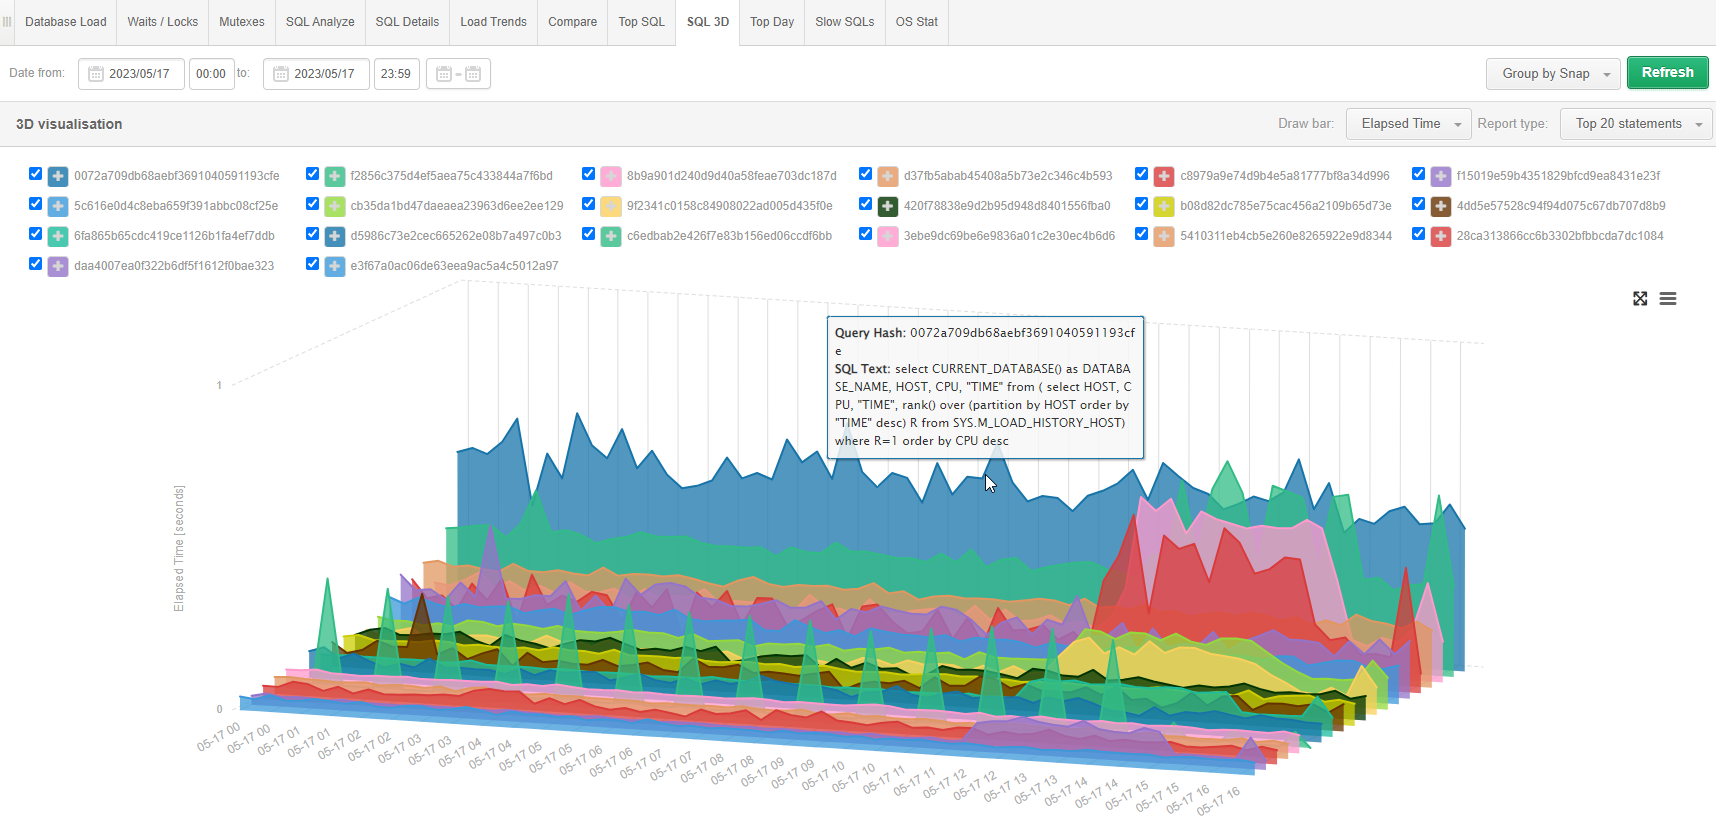
The module, by means of a 3D chart, presents the most loaded queries according to the
indicated performance statistics. In the application we have the possibility to examine the
heaviest queries in terms of, for example, Elapsed Time of queries, number of executions,
amount of memory utilized, number of rows processed, etc.
The queries are presented in the form of a 3D chart in descending order w/values for a given
statistic over the selected time period. This makes it easy to determine when and which query
most affected performance in terms of a given statistic.
The selection of the statistic for which the queries will be presented is done by changing in
the Draw bar field.
Statistics are always presented for the selected time period. We also have the ability to group the displayed statistics by:
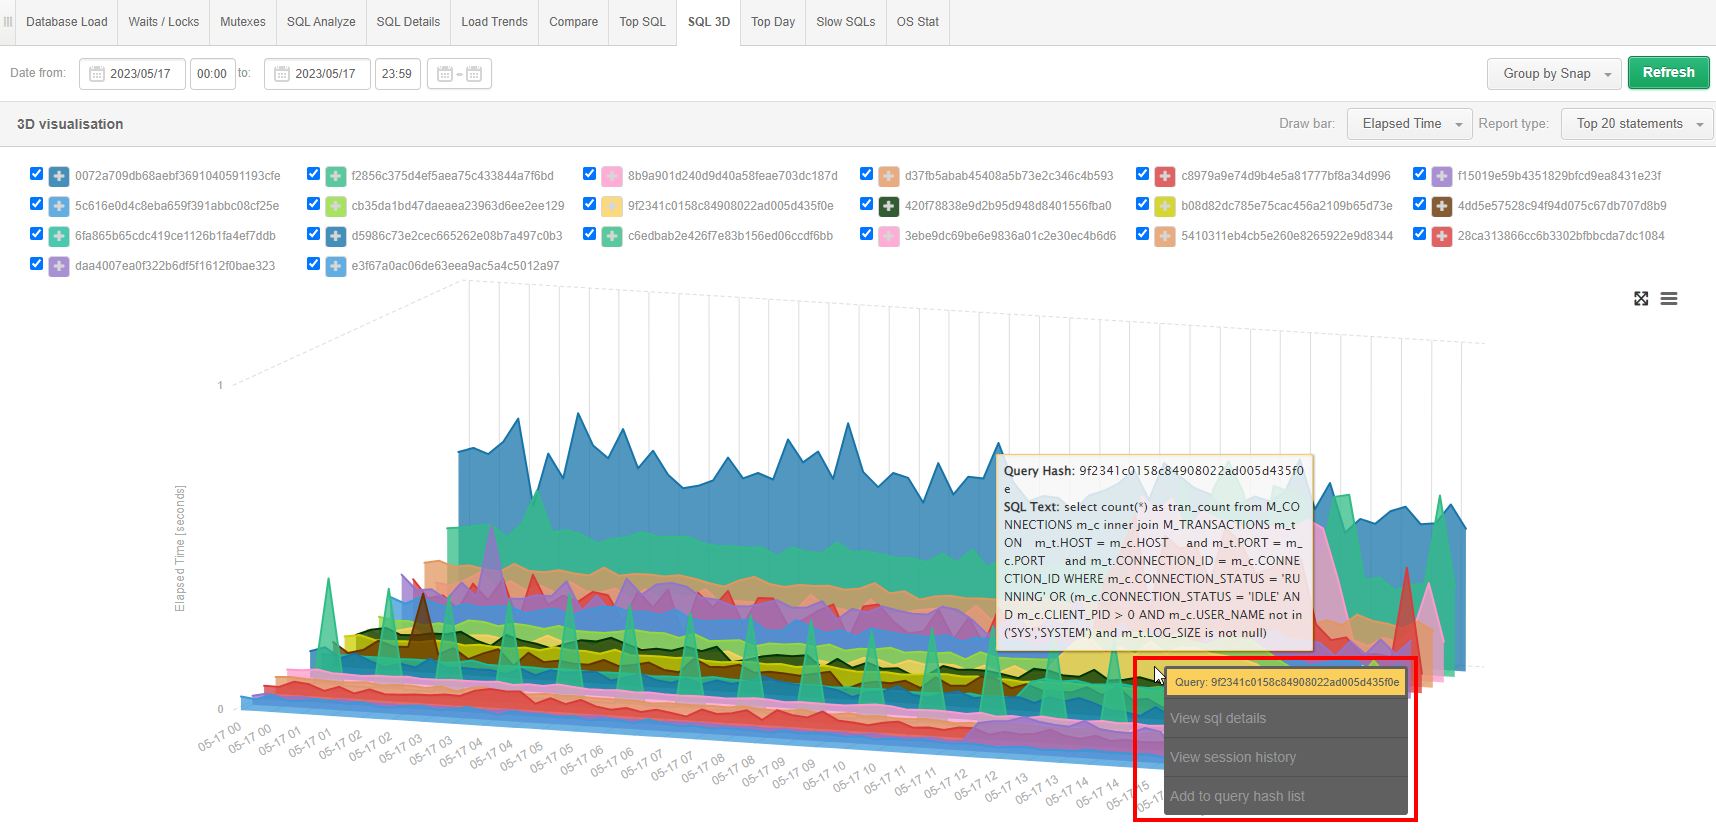
From the screen, you can easily add a query for detailed analysis in SQL Details by clicking on the [Plus] button next to the query ID or pointing at the chart of the query of interest, an additional menu will open, containing the option:
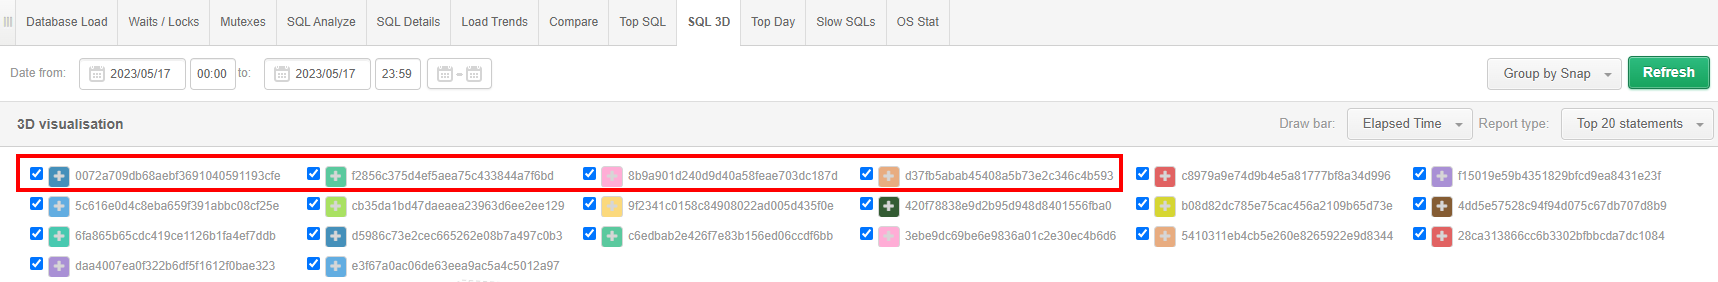
Using the check boxes in the legend, we can remove individual queries from the SQL 3D view:
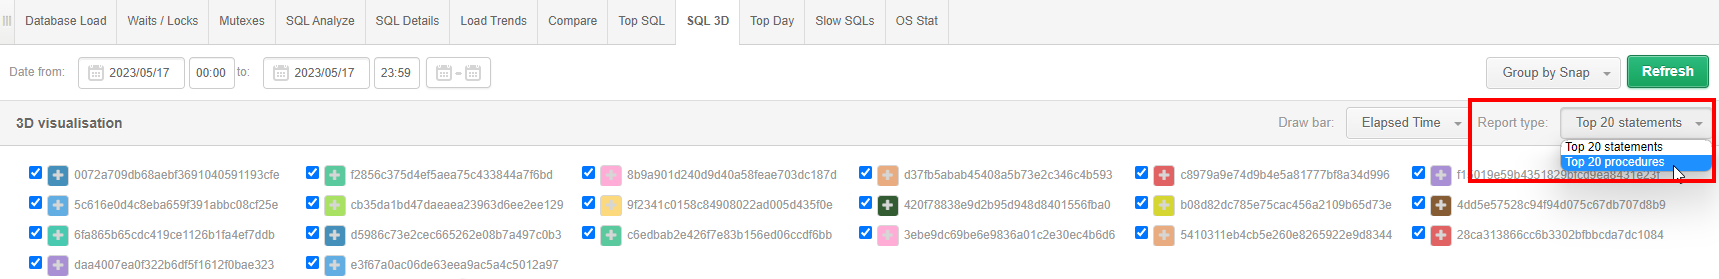
In addition, the user has the ability to change the presentation of the data on the screen through an additional filter Report type, which allows to change the presentation of the top queries to another view showing the top queries: