The module presents the most stressful queries according to the indicated performance
statistics. In the application we have the possibility to examine the heaviest queries in
terms of, for example, Elapsed Time of queries, number of executions, amount of memory
utilized, number of rows processed, etc.
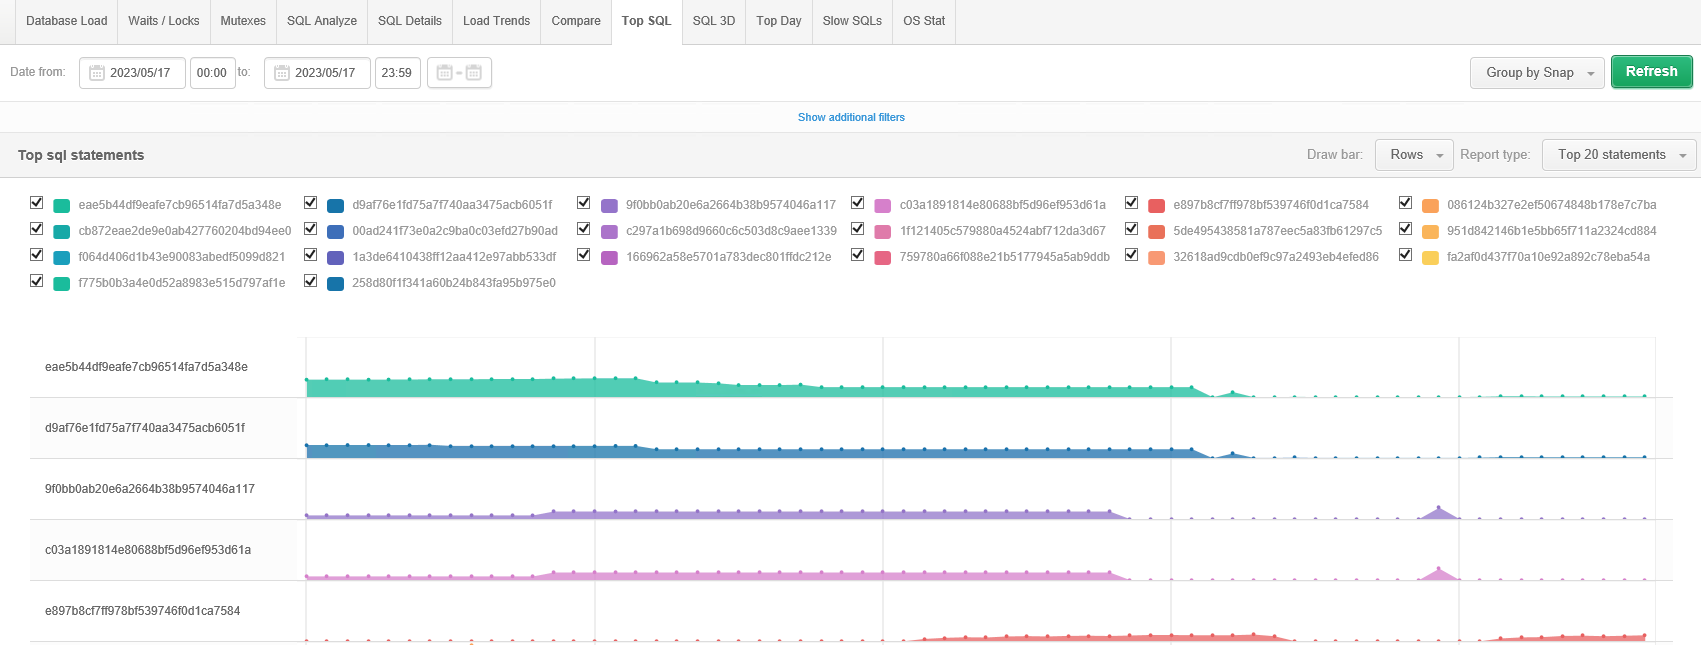
Queries are presented as graphs in descending order w/values for a given statistic over a
selected time period. This makes it easy to determine when and which query had the greatest
impact on performance in terms of a given statistic.
The selection of the statistic for which the queries will be presented is made by changing in
the Draw bar field.
Statistics are always presented for the selected period of time. We also have the possibility to group the displayed statistics by:
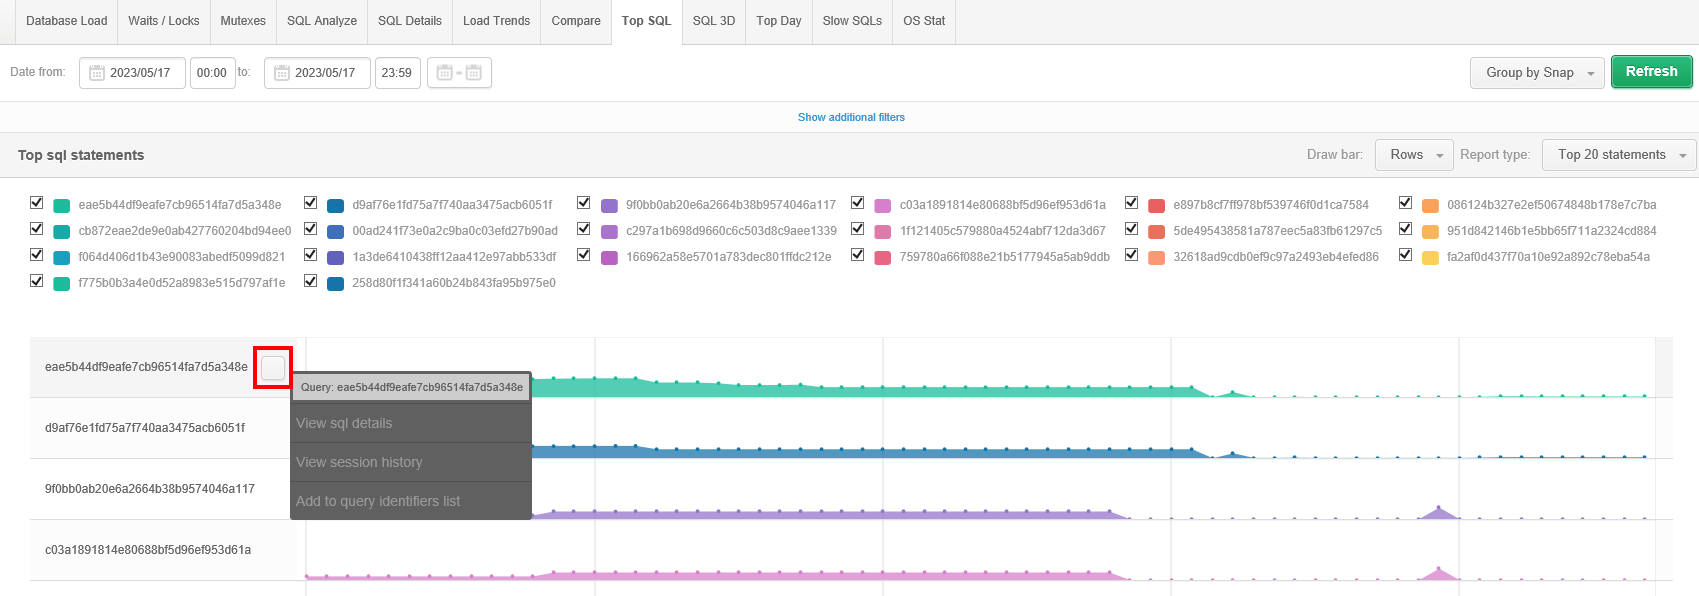
From the screen, it is easy to add the query of interest for detailed analysis in SQL Details by clicking on the [Plus] button next to the query ID and selecting the option:
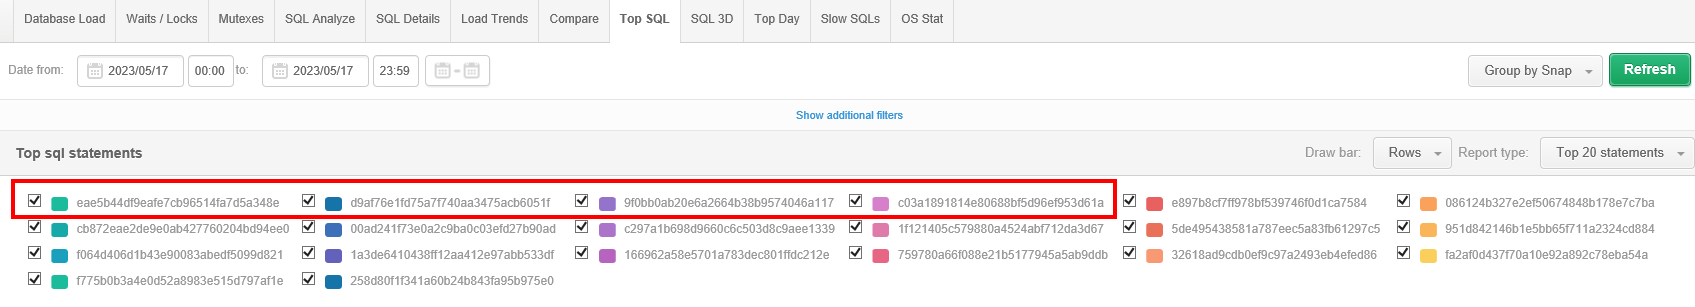
Using the check boxes in the legend, we can deselect individual queries from the charts view:
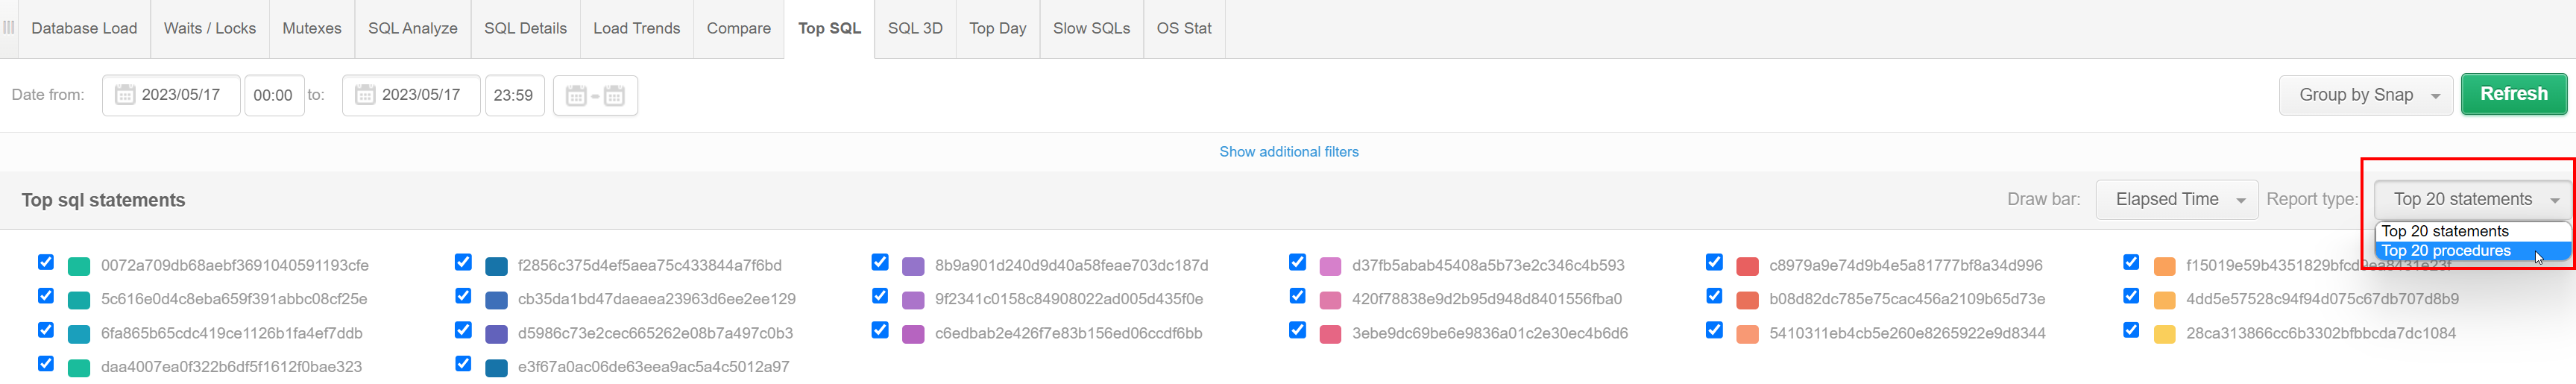
In addition, the user has the ability to change the presentation of the data on the screen through an additional filter Report type, which allows to change the presentation of the top queries to another view showing the top queries: