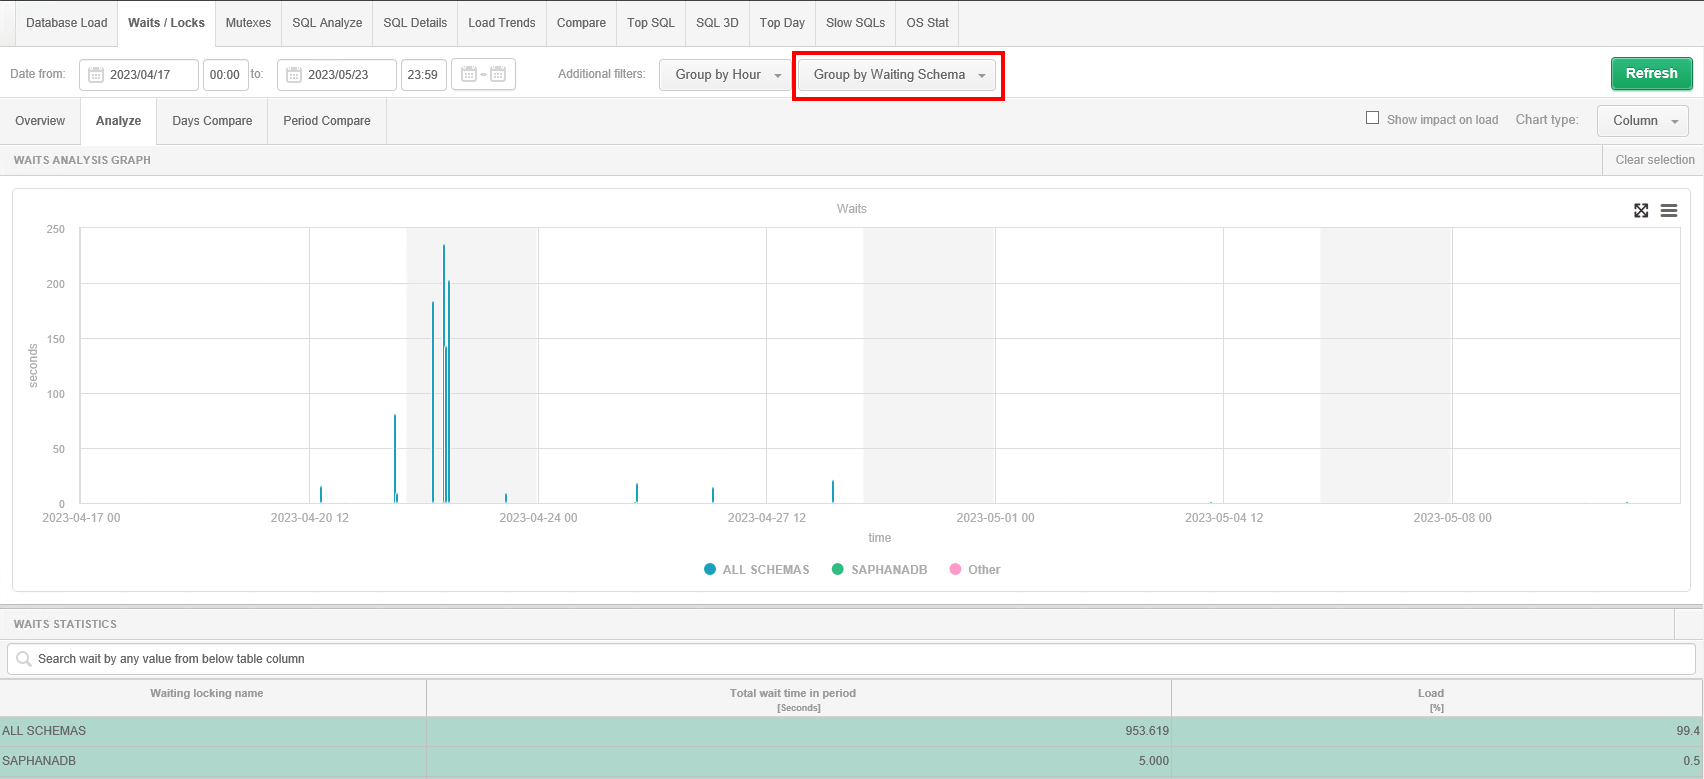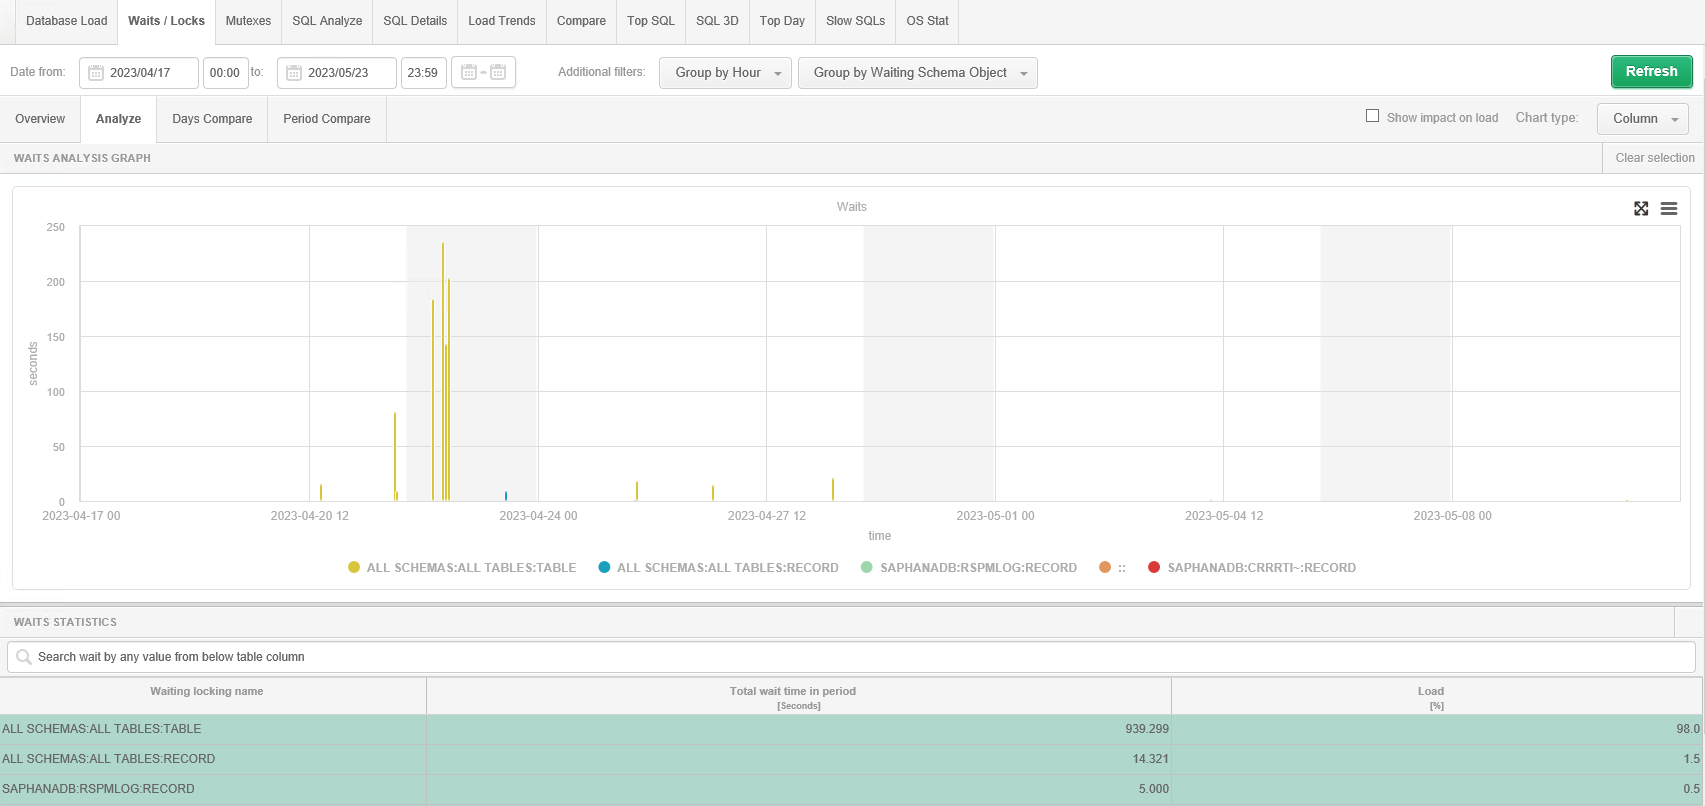
On the screen, the user is able to analyze waits affecting performance. Chart presentation is available using grouping by day, hour, snap (15 minutes). An example of the analysis result presented below:
Series are added to the chart by selecting a selected row with an waits. The table shows the name of the wait, the class, the total time for the selected period, and the percentage compared to the other waits.
Grouping by schema
Depending on the period that has been selected, the chart displays what is the share of a
given wait in grouping by schema (option Group by Waiting Schema Object) in
the total number of waits.
The Show impact on load option allows you to determine the share of analyzed
waits in relation to all waits in a given time period.