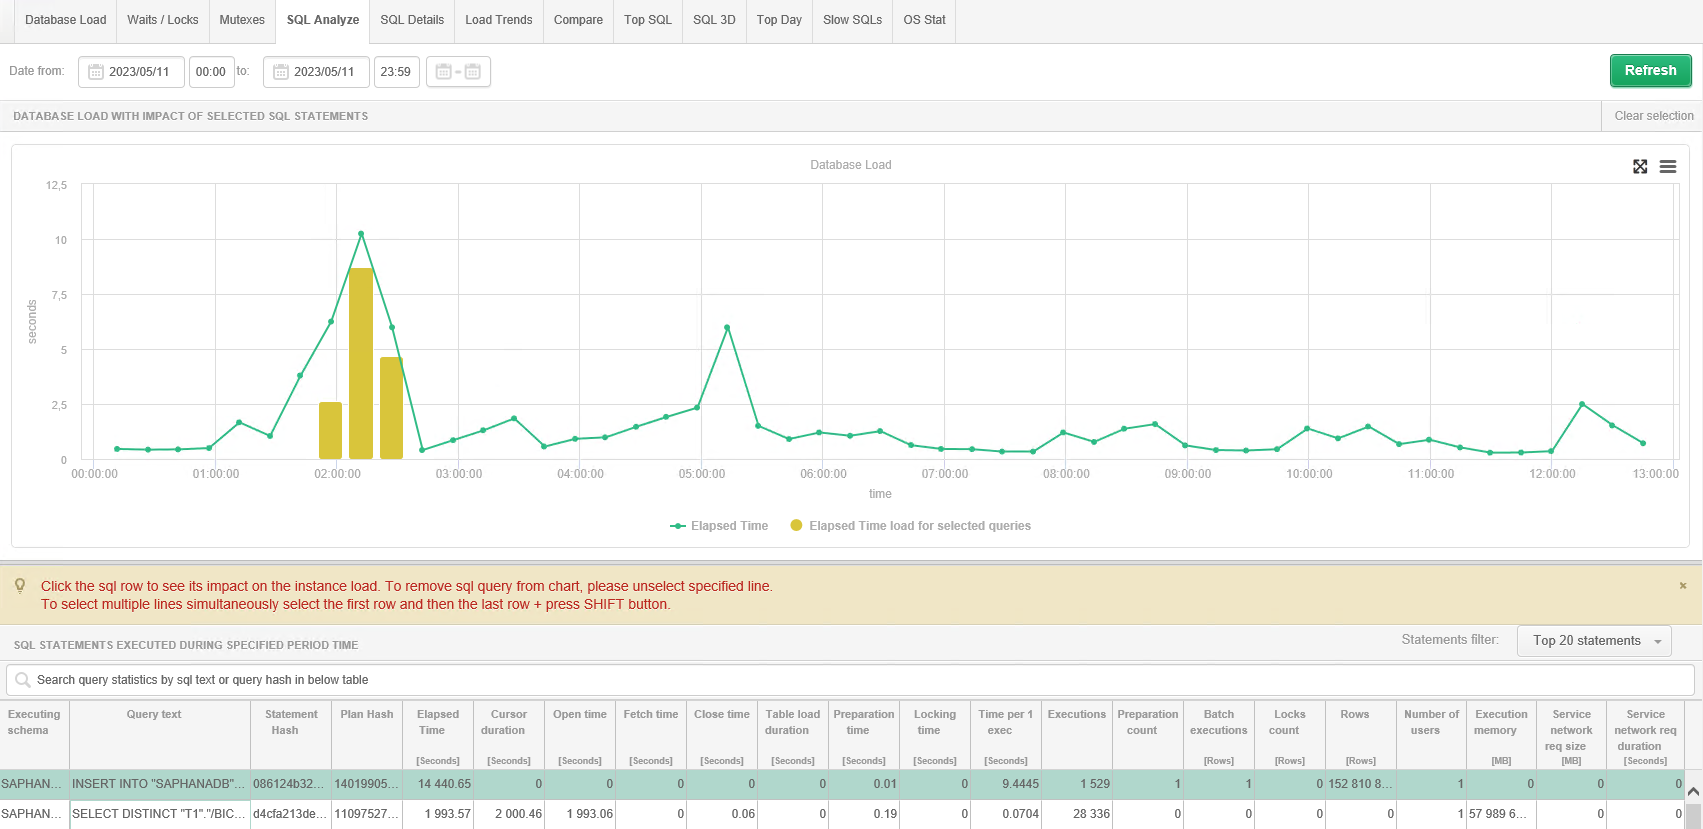
The module presents information about the contribution of individual queries to the total duration of all queries in the database.
The Y axis of the graph represents the number of seconds for each second of query duration in the database. The X axis represents the point in time at which a given query was executed in the database.
The top 20 queries sorted by Elapsed Time were displayed under the chart. Selecting a row/rows in the table displays the share of a given query (vertical columns in the chart) in the utilization of a given statistic. This method allows you to easily and precisely determine which query took the longest time to execute in the database at a given point in time.
The fastest improvement in the performance of the monitored database can be achieved by optimizing the queries that are most involved in the utilization of a given resource. The SQL Analyze screen precisely indicates the contribution of queries to the utilization of the entire database.Important
In addition, as on the other screens in the Query Hash column, a [Plus] button is shown next to each row showing the performance statistics, after clicking which a context menu is opened.
If you select SQL Details you will go to a detailed analysis of a given query.