The SQL Details module presents detailed information about queries. On the
screen, we can verify the most important information about the operation of the query in the
database, such as: duration and impact on memory utilization, whether the query changed the
execution plan, the number of records returned, the number of executions , etc.
This information gives you the ability to decide whether it makes sense to optimize a given
query and assess its contribution to the load on the entire database.
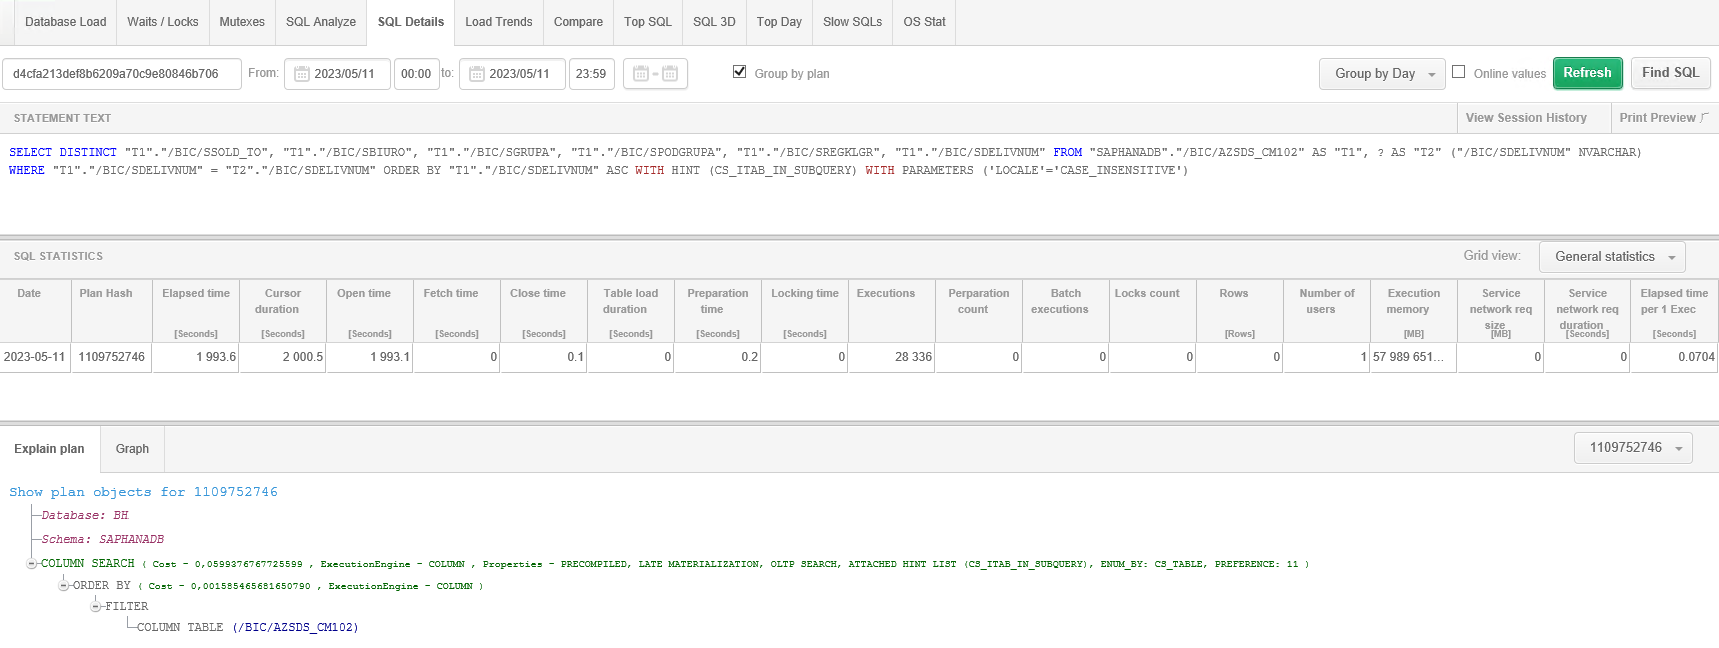
On the screen, the user can search for any query by completing the Enter statement hash field. The query statistics are always presented for the selected time period. We also have the ability to group the displayed statistics by:
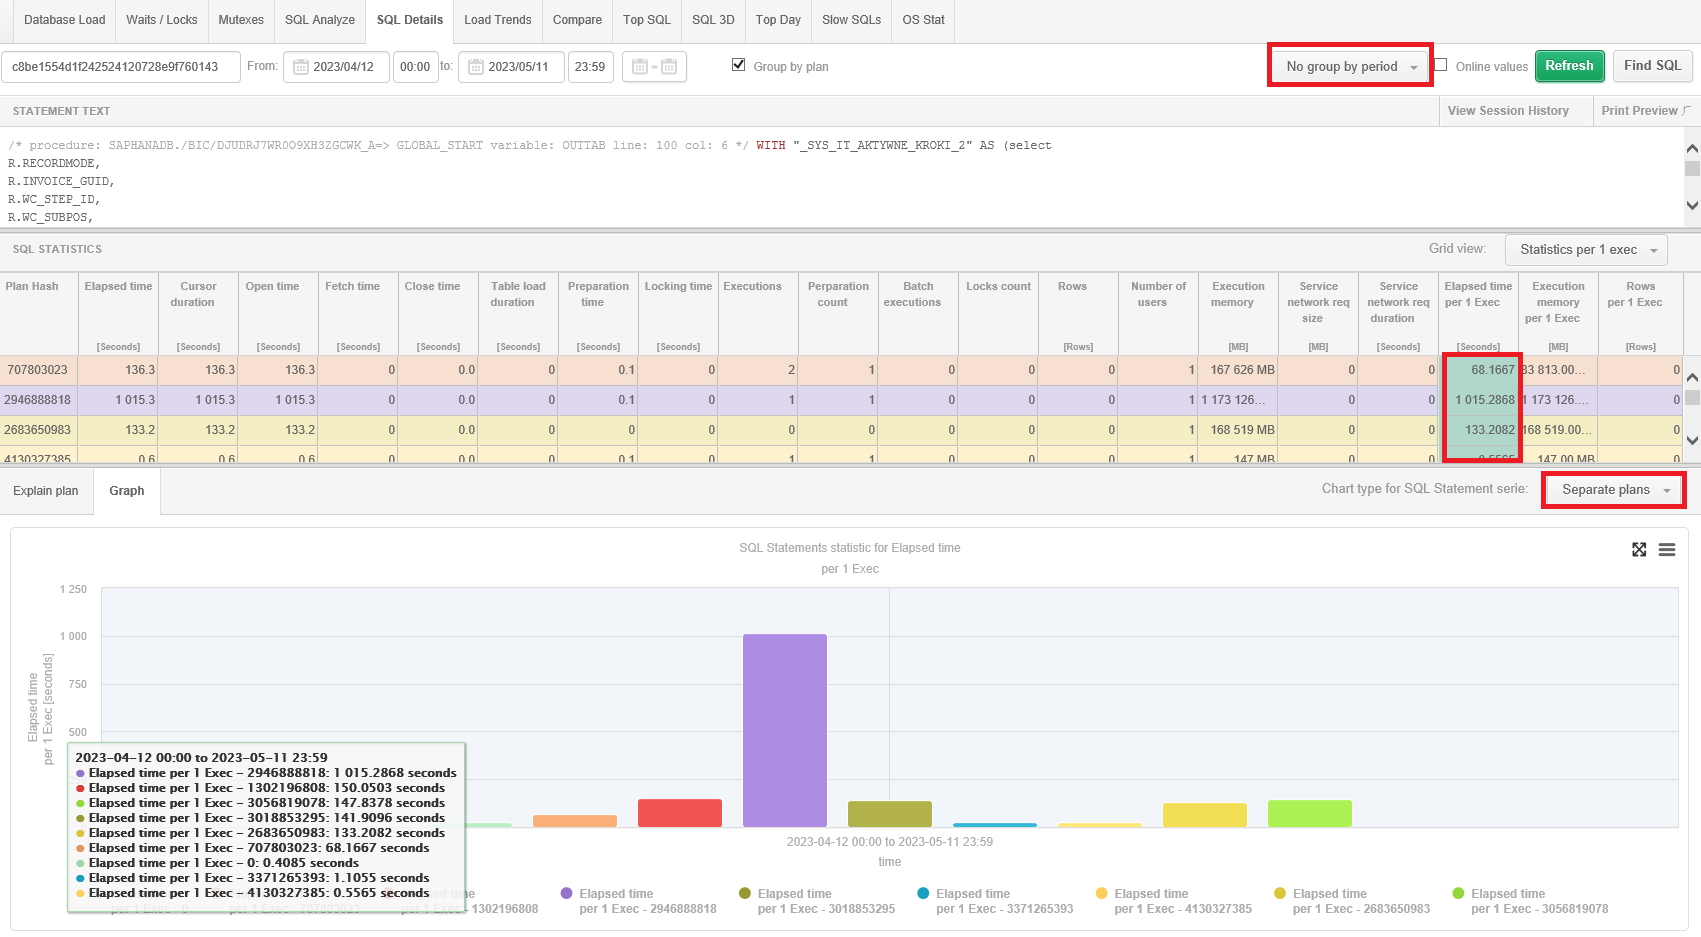
The No group by period option allows you to display summarized all statistics
for whole selected time period. All data is also grouped by execution plan
Plan hash by default. The user has the option to present statistics for all
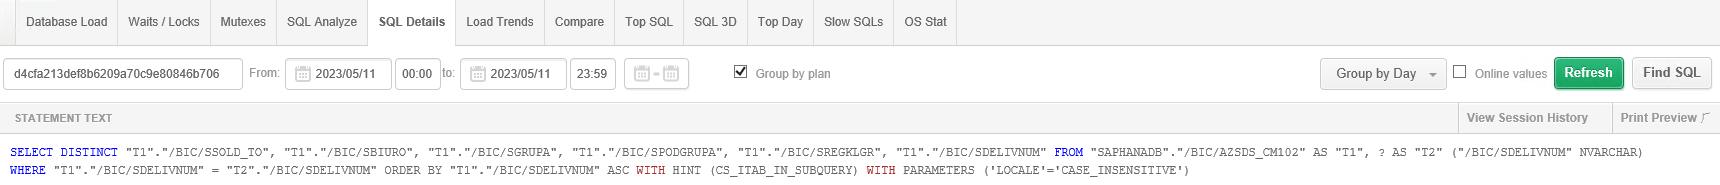
executions of a given query without grouping by plan by unchecking the
Group by plan options.
The View session history option allows you to display the session history for the query you are analyzing. By viewing the information contained in the session history, we have the ability to verify, for example, by whom a given query is run, from what machine or with what type of wait it was expecting during execution.
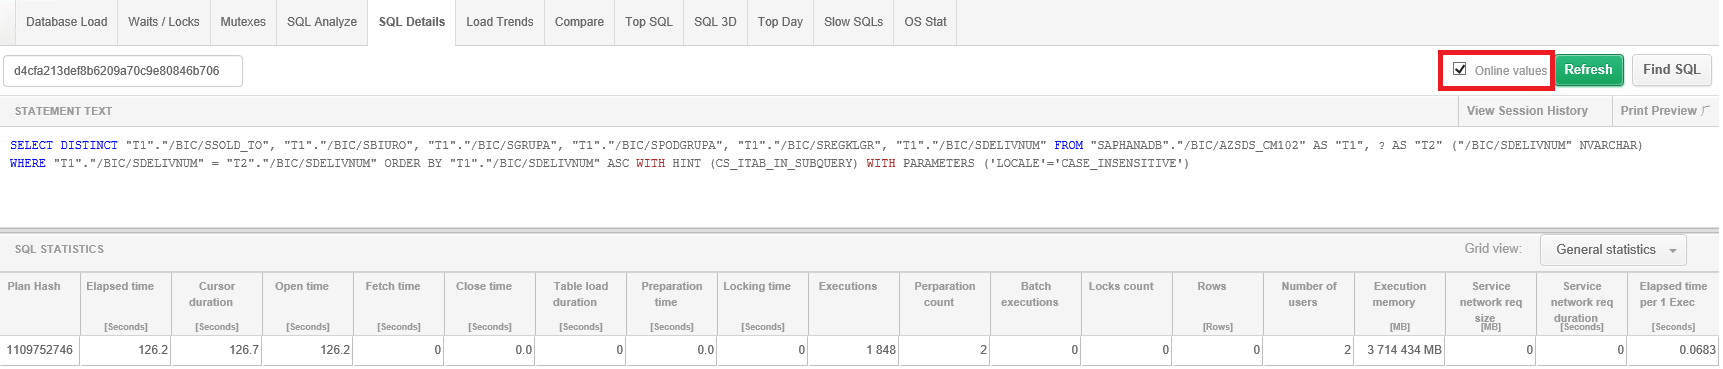
Online Statistics
The information visible on the SQL details page is read from the data collected during monitoring and stored in the repository. It is also possible to verify Online data, that is, read directly in real time from the monitored database. Checking the Online Values checkbox, causes some of the filters to be hidden and after clicking the [Refresh] button, the application presents the statistics of a specific query according to the information available in the system view.
Execution Plan - Explain Plan
Execution plan allows you to verify how the database engine reads data from the tables that are part of the analyzed query. Every query should have at least one execution plan. There are also queries which in the analyzed period of time were executed using multiple execution plans. If there is more than one plan in the analyzed time period, the application presents an option Compare plans, which allows you to compare two execution plans - additionally, the differences between the plans are highlighted in yellow color.
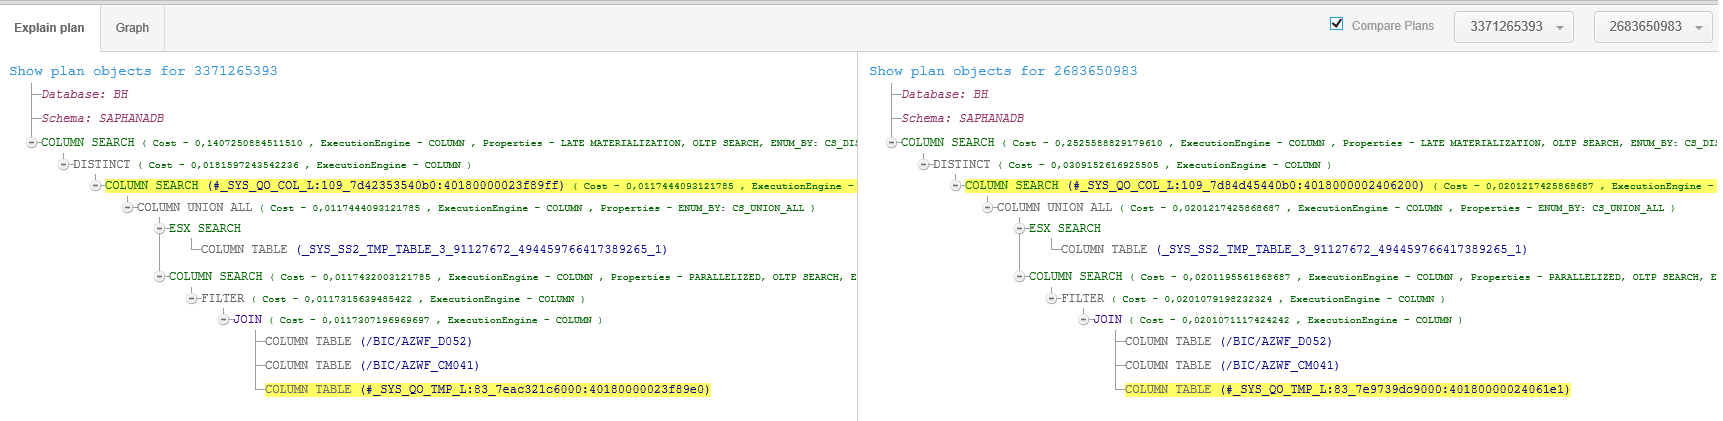
In order to optimize the query, it is necessary to verify that the database optimizer has chosen the correct path for reading data from objects for the query being executed. For easier analysis of the execution plan in the application, the query object analysis functionality Show plan Objects is available.
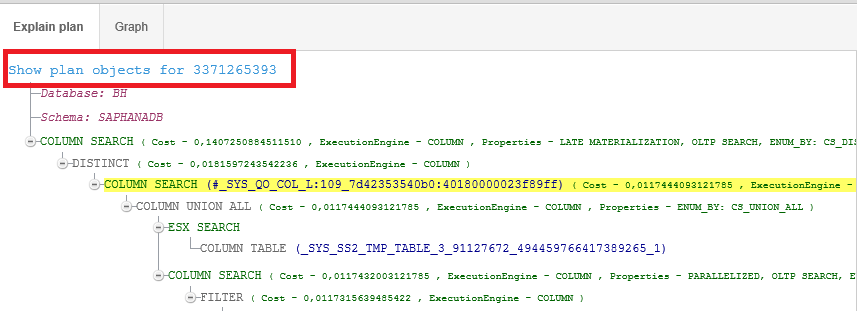
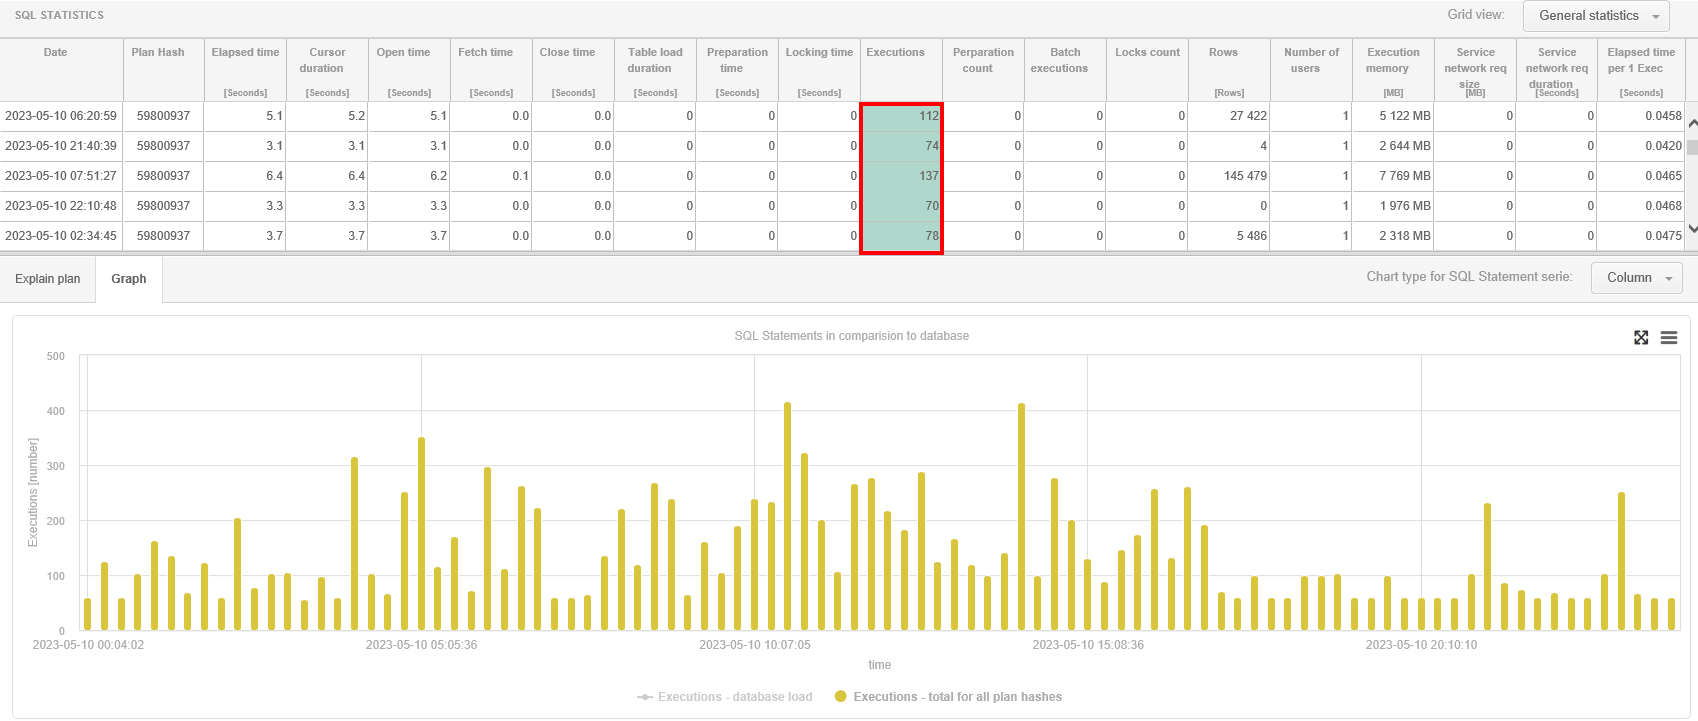
Chart - Graph
For the analyzed query, we have the possibility to present the collected data on a graph. To do this, go to the Graph tab and then click on the data area for the selected statistic. As a result, the data for the selected period will be presented on a graph.
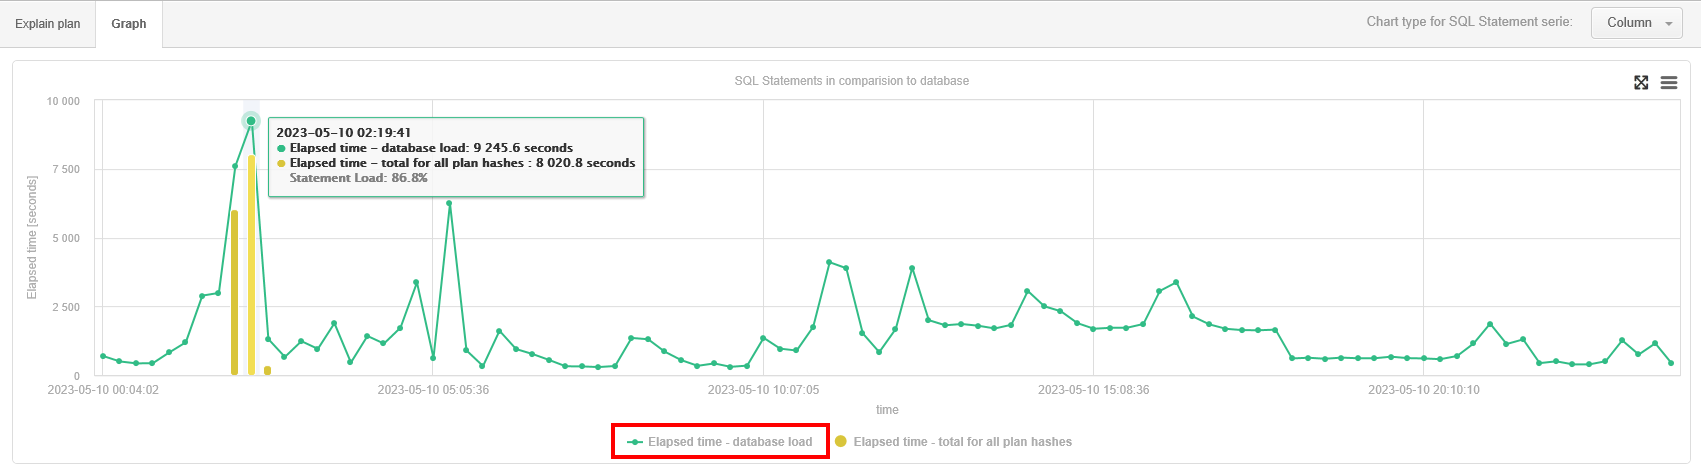
In addition, you can easily verify what impact a query has on a given statistic, e.g. Elapsed Time compared to the time generated by all queries in the database. To do this, simply click on the series below the Elapsed Time - database load chart, which will bring up an additional green line showing the load generated by all queries.
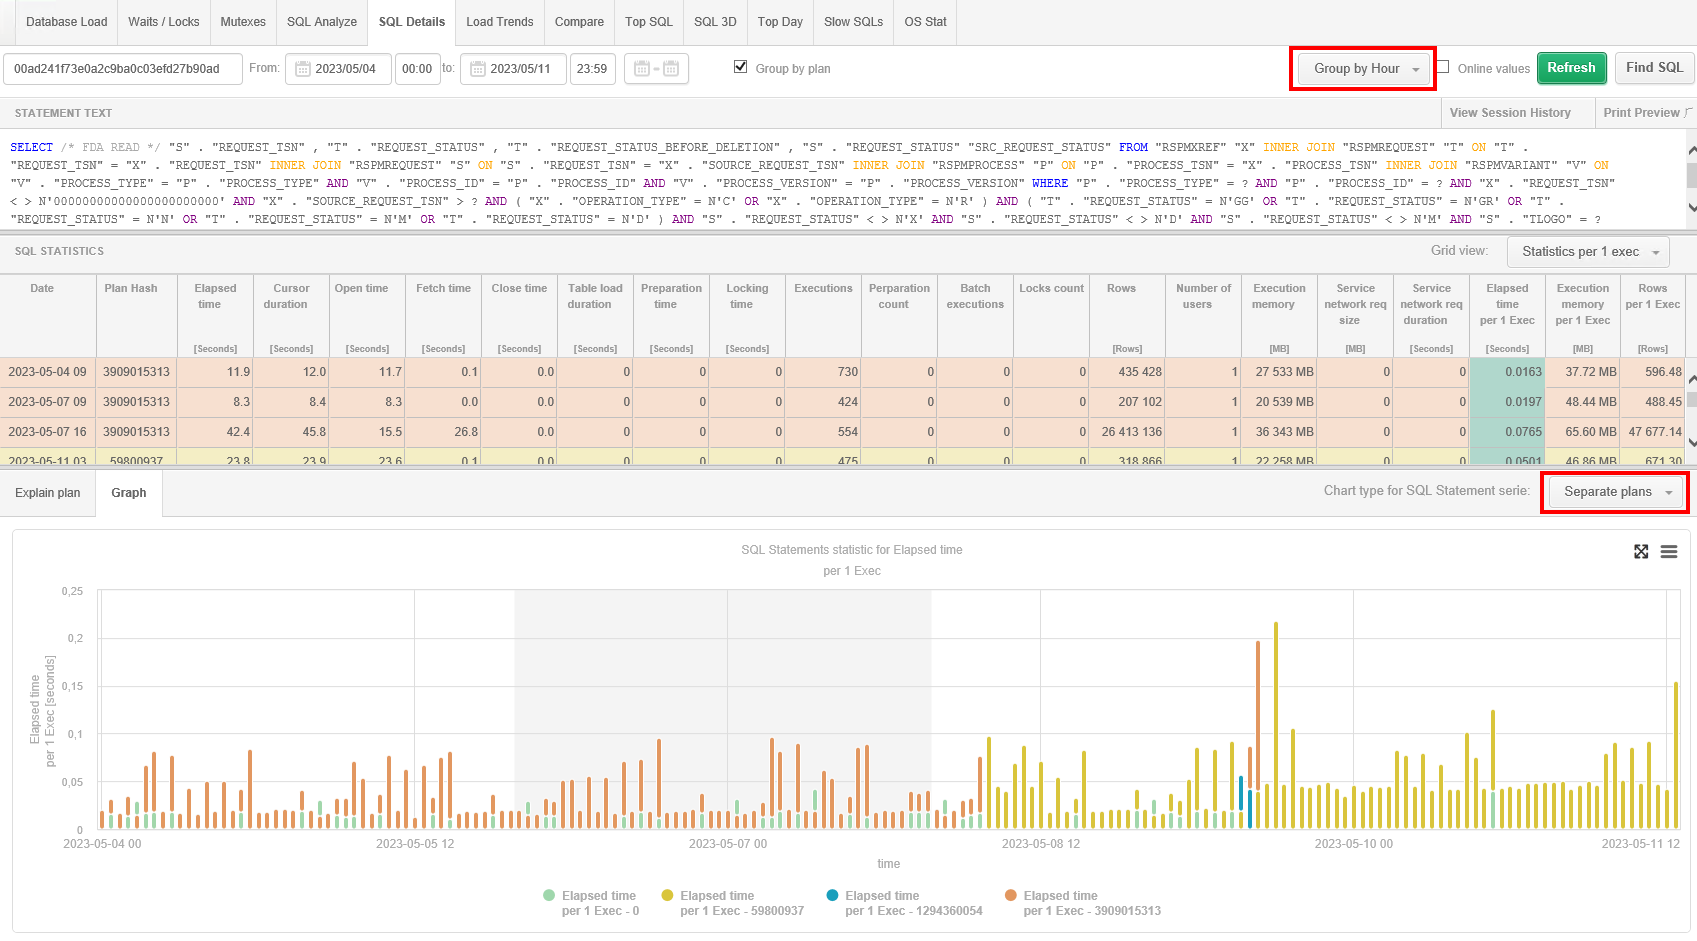
In case the query uses multiple execution plans in the monitored period in the Graph tab, a special type of graph Separate plans has been added. This function on the graph shows separate data for each plan (with a different color). In Separate Plans mode, the rows in the table are colored according to the color shown on the graph for a given query plan.
After changing to group by hour or snap (15 minutes), the user will easily get information when and at what times the query uses the slower schedule.
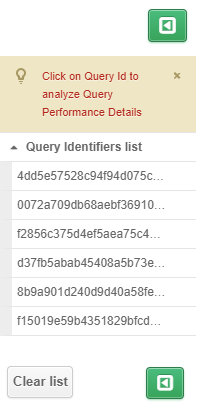
Cache
Me screen provides a cache containing query identifiers. The list of queries is remembered within an instance for a specific user. This list can be saved to a file or read again. Queries can be added to the clipboard from any page in Performance Monitor containing a query ID. Clicking the [Plus] button, opens a context menu where the options Add to query hash list causes the query to be added to the list on the clipboard.