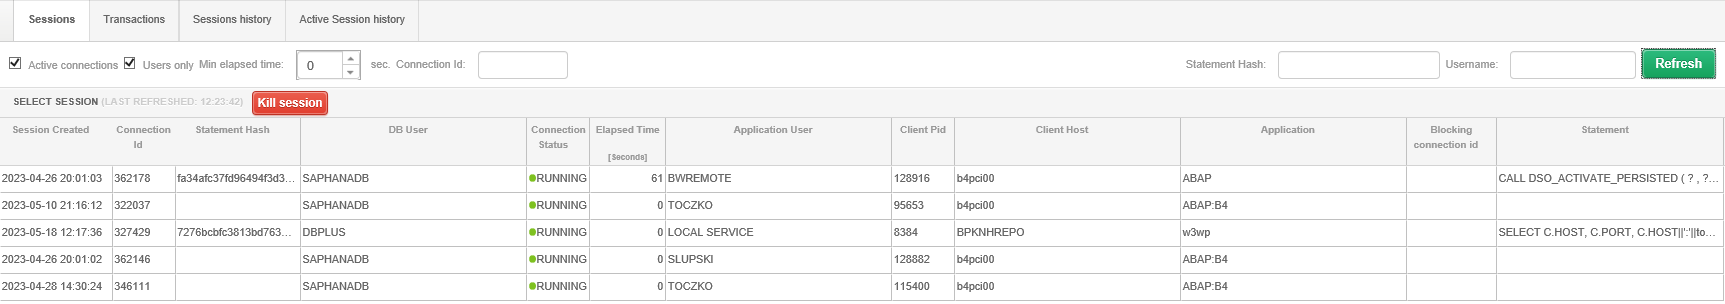
The module presents current information about sessions running on the monitored database. The
session information can be refreshed each time using the [Refresh] button.
The screen contains a number of options for searching sessions in the monitored database. On
the screen, the Active connections, and Users only filters
are active by default, unchecking of which will display inactive sessions and
system sessions, respectively.
Additionally, we have the option to filter out
sessions whose time is shorter than the set parameter Min elapsed time.
The next options allow to filter sessions based on:
There is a [Kill session] button on the screen, which allows you to delete an
active user session. This operation is available only when the DBPLUS user assigned to
monitoring has additional permissions. Default permissions do not allow deleting the session.
The visibility of the button can be limited by assigning appropriate permissions (Function
rights) at the Security.
screen level.
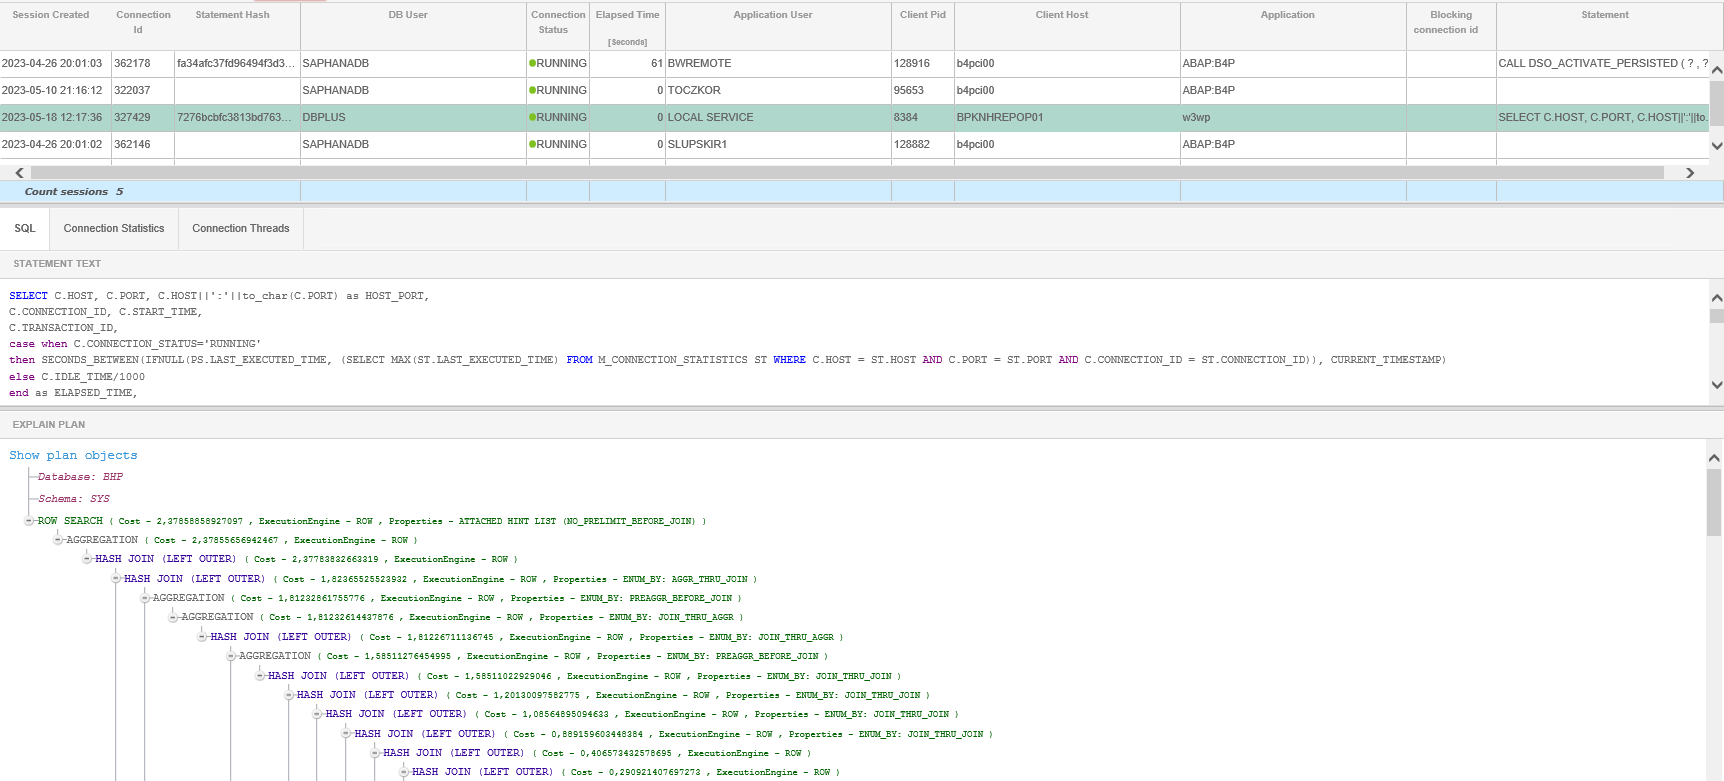
Session information is presented in a table. If you hover over a row, additional options will
be displayed in the Query hash column - the options allow you to verify the
query details or session history for the indicated query.
Clicking on a row in the table will present additional information in dedicated tabs:
SQL
Includes information about the text of the query and the execution plan. From the post-screen, we can analyze the plan objects by clicking on Show Plan Objects option
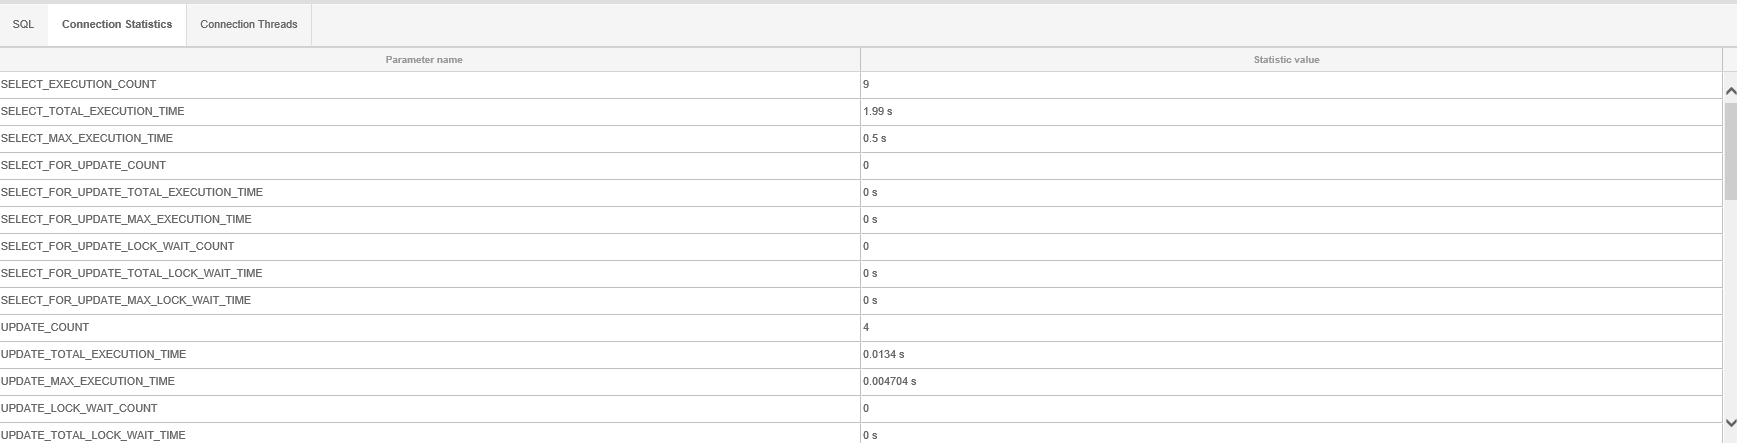
Connections statistics
Contain the status of the execution of the current operation by the indicated database session and additional statistics.
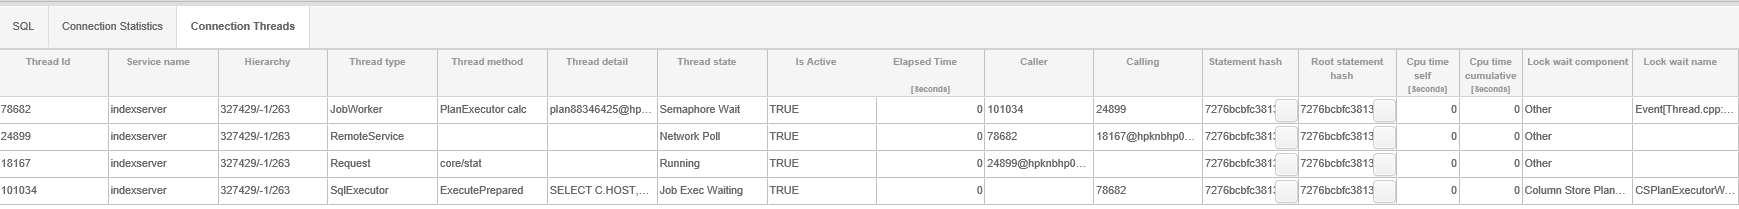
Connection Threads
The tab shows the tasks/threads for the session - below is a screen with the session broken down into individual threads.