In the DBPLUS Performance Monitor application there is an Anomaly Monitor module which contains information about detected problems in the monitored SQL instance. The data on the page is presented in two tabs:
The Anomaly Monitor tab presents events detected in the monitored SQL instance based on the study of trends for key performance statistics. Queries executed in the SQL instance, disk array performance, as well as statistics on leading waits affecting performance are reviewed. Monitoring includes information on problems divided into classes:
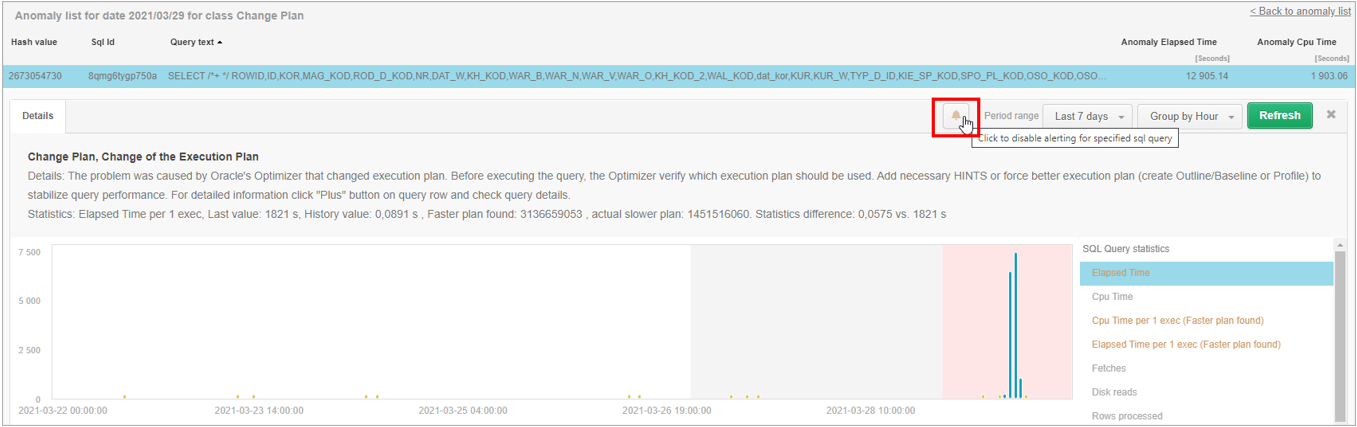
Problems presented in this class are related to the change of the execution plan. When a drop in the performance of a given query is detected, the applications verifies whether the event is related to the plan change at the same time it checks whether a faster/better plan can be found in the history for a given query. The number of days taken into account in the search for a faster plan depends on the History Days for Plan Change Estimation parameter available in the Alerts Settings menu under the General settings tab. By default, the parameter value is set to 30 days.
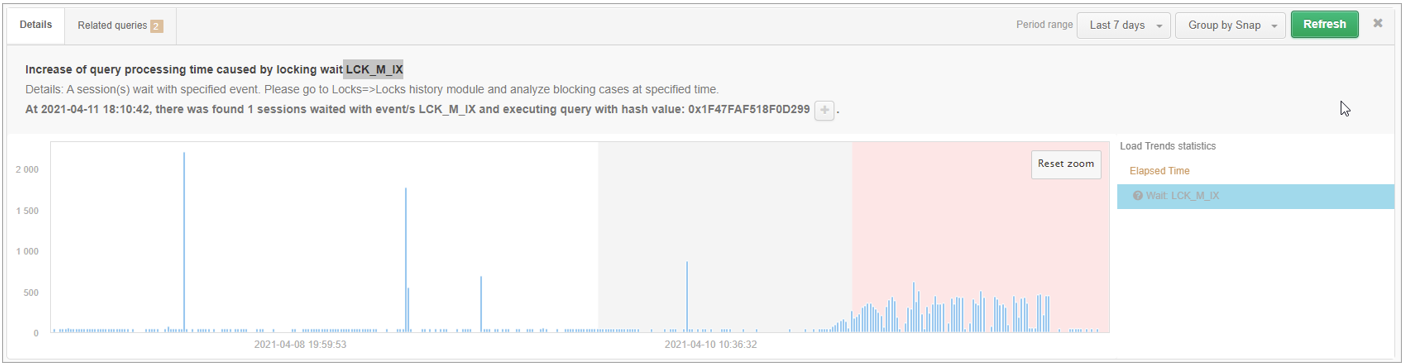
This class contains events related to the occurrence of locks in the monitored SAP HANA instance.
The cause of the occurrence of this class of problems is the appearance of a new query that has not been executed so far or has not been previously detected by DBPLUS monitoring, while at the same time significantly utilizing the resources of the SQL instance in which it is executed. Information about the detection of a new query will be visible for a period of 3 days after its occurrence is dependent on the new parameter Number of days to concider statement as NEW available in the menu tab General setings The New SQL Statment problem will also not occur if the query is not a significant performance impact.
The SQL Statement class indicates a problem with queries for which there has been a deterioration in the overall Elapsed Time statistics. However, the source of the deterioration in query duration was not detected.
For queries assigned to this class, there was an increase in the amount of data read from the memory buffer.
This class groups together queries for which an increase in the amount of data read from disk resources was detected compared to the historical trend for a given statistic.
For queries assigned to this class, the problem detected a significant increase in the number of executions in a given snap compared to the history of a given query for the last 30 days. The administrator should verify what is the reason for the sudden increase in the number of executions of the associated query problem.
This class contains an increase in the level of expectation for which a dedicated class has not been defined. In future versions of the application, the cases contained in the Other class will be described and analyzed to find the source of the problem.
Page Navigation
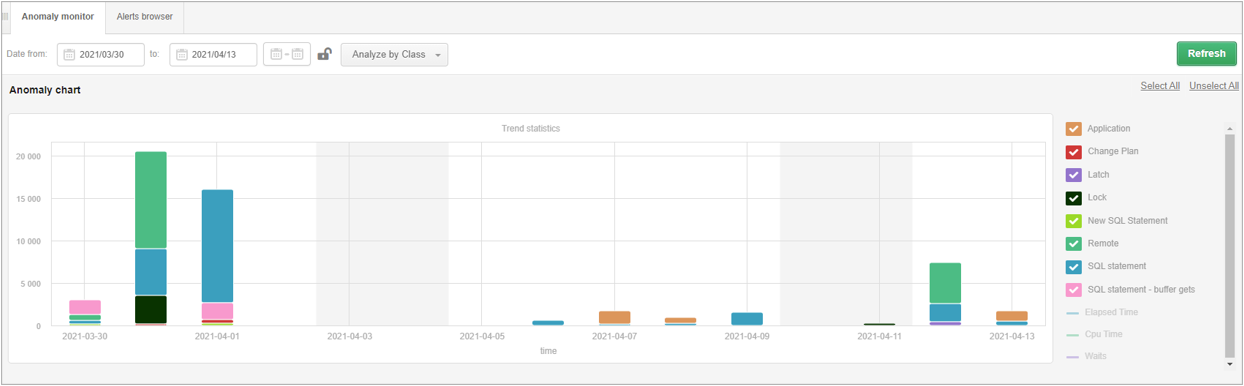
Each class available on the chart is shown in a separate color. The height of the bar depends on the impact of the class on performance. The bigger/severity of the problem detected, the higher the column with the given color will be.
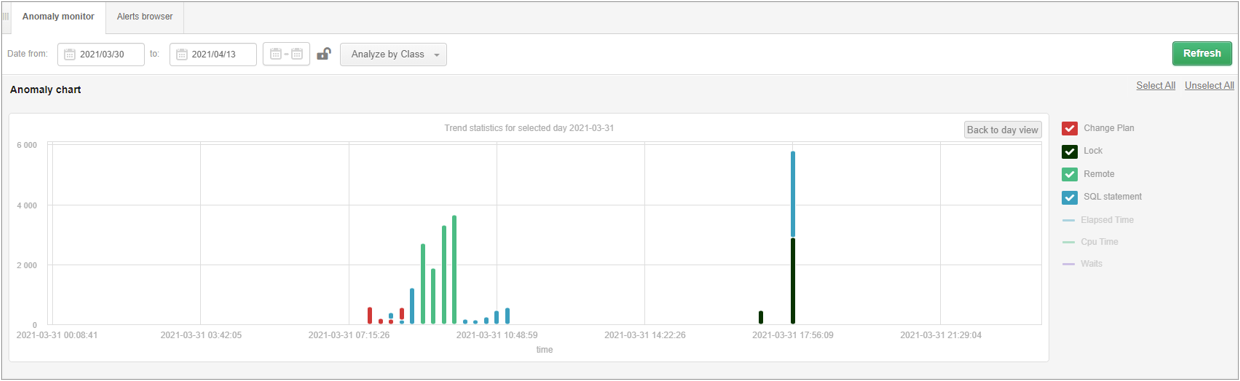
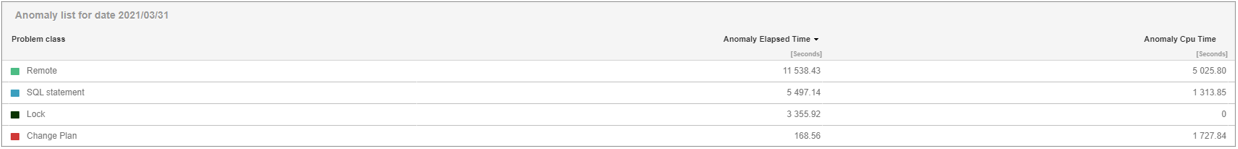
Under the graph, a list of classes of performance problems that were detected in the presented period is displayed. To verify the problem, we select the day by clicking on the chart to verify the performance problems. The next graph shows the classes of problems detected on a given day.
For detailed analysis, click on the line with the class of the problem for which you want to verify the cause of the problem.
The following is a query problem for which a schedule change event was detected. Selecting a given row opens a panel with details of the given query. On the legend on the right side of the graph are highlighted in orange those statistics for which the threshold values were exceeded.
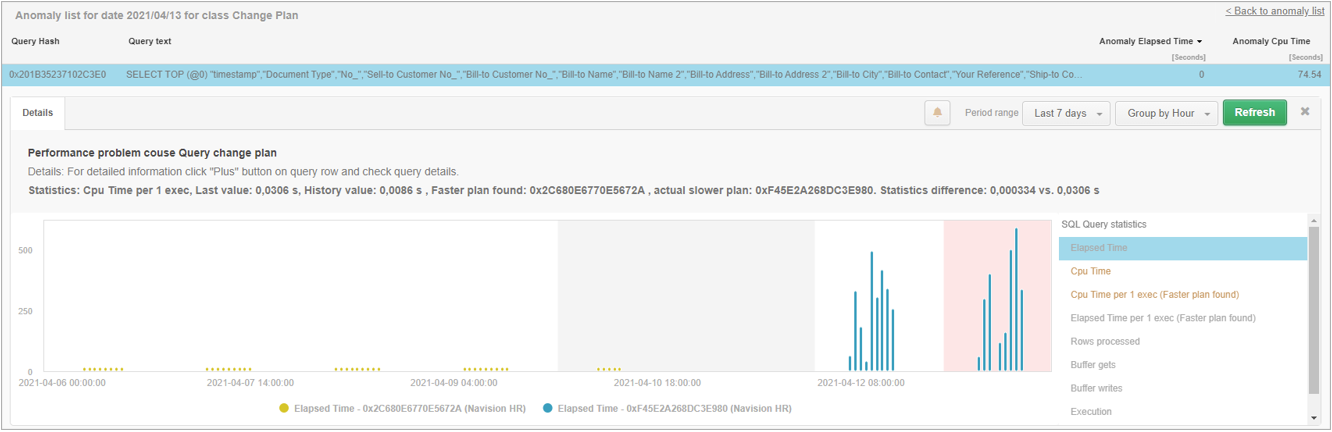
Above the chart, a general description of the problem (Details) is presented, along with an indication of the fastest plan for the studied query. In case of a plan change, the chart presents information grouped for each plan separately.
In the case of detecting a problem related to exceeding the trend level for a given wait (e.g. LCK_M_IX), the Details tab presents general information about the exceeded statistics for a given wait with information on the reason for the increase in the level of a given wait. In addition, in the Related queries tab, the queries for which the wait for a given wait was the highest in the examined time period were linked.
Exlude alerts
Exclusion of monitoring queries is a functionality useful when alarm thresholds are frequently exceeded for a given query and the Administrator has no way to improve the performance of a given query (e.g., for a query on system views or without limiting conditions). Configuration of excluding a query from monitoring is available in the Configuration > Alert Settings menu under Exlude Alerts.
On pages where alerts are visible, we have added the ability to quickly exclude monitoring queries. To exclude, click on the “bell” icon. After accepting the selection, the given query will be added to the exclusion configuration.
In order to re-enable the monitoring query, the exclusion can be clicked again from the alert level, restoring the monitoring query. In this case, the exclusion entry will be removed from the configuration.