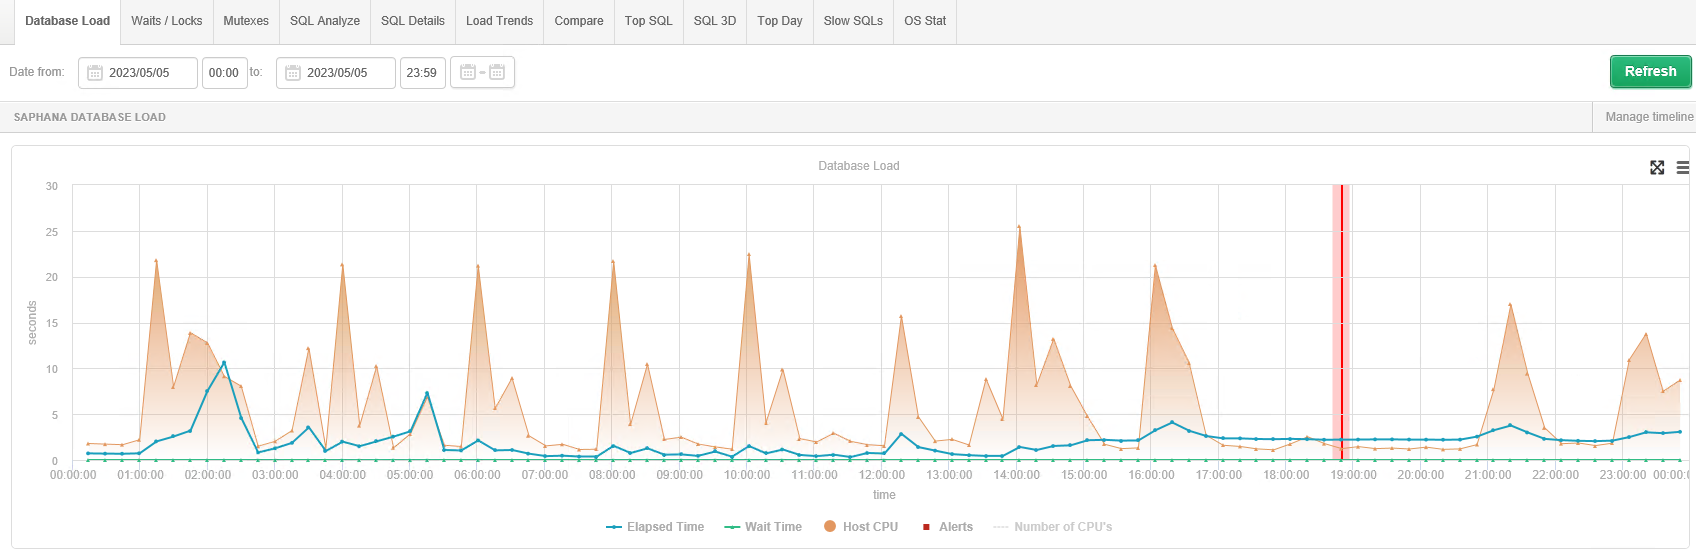
The screen presents a graph of the database load for the selected period. The graph consists of the following series:
The graph shows the performance of the SAP HANA database over a given period of time. In the morning hours you can see an increase in the duration of queries to the level of 10s per second, then there is a decrease in the duration of queries until 2 p.m. After 2 p.m. until the end of the day, queries last up to 2s per second.
The data for the instance load graph is calculated by the DBPLUSSAPHANACATCHER service - one of the components of the DBPLUS Performance Monitor system. The monitoring service performs a series of procedures that examine the performance of the instance. The result from the operation of these procedures is a snapshot (snap), which is executed every 15 minutes.Important
When you click on the selected point on the graph, the queries executed in the monitored database during the last 15 minutes counting from the date indicated on the graph will be displayed.
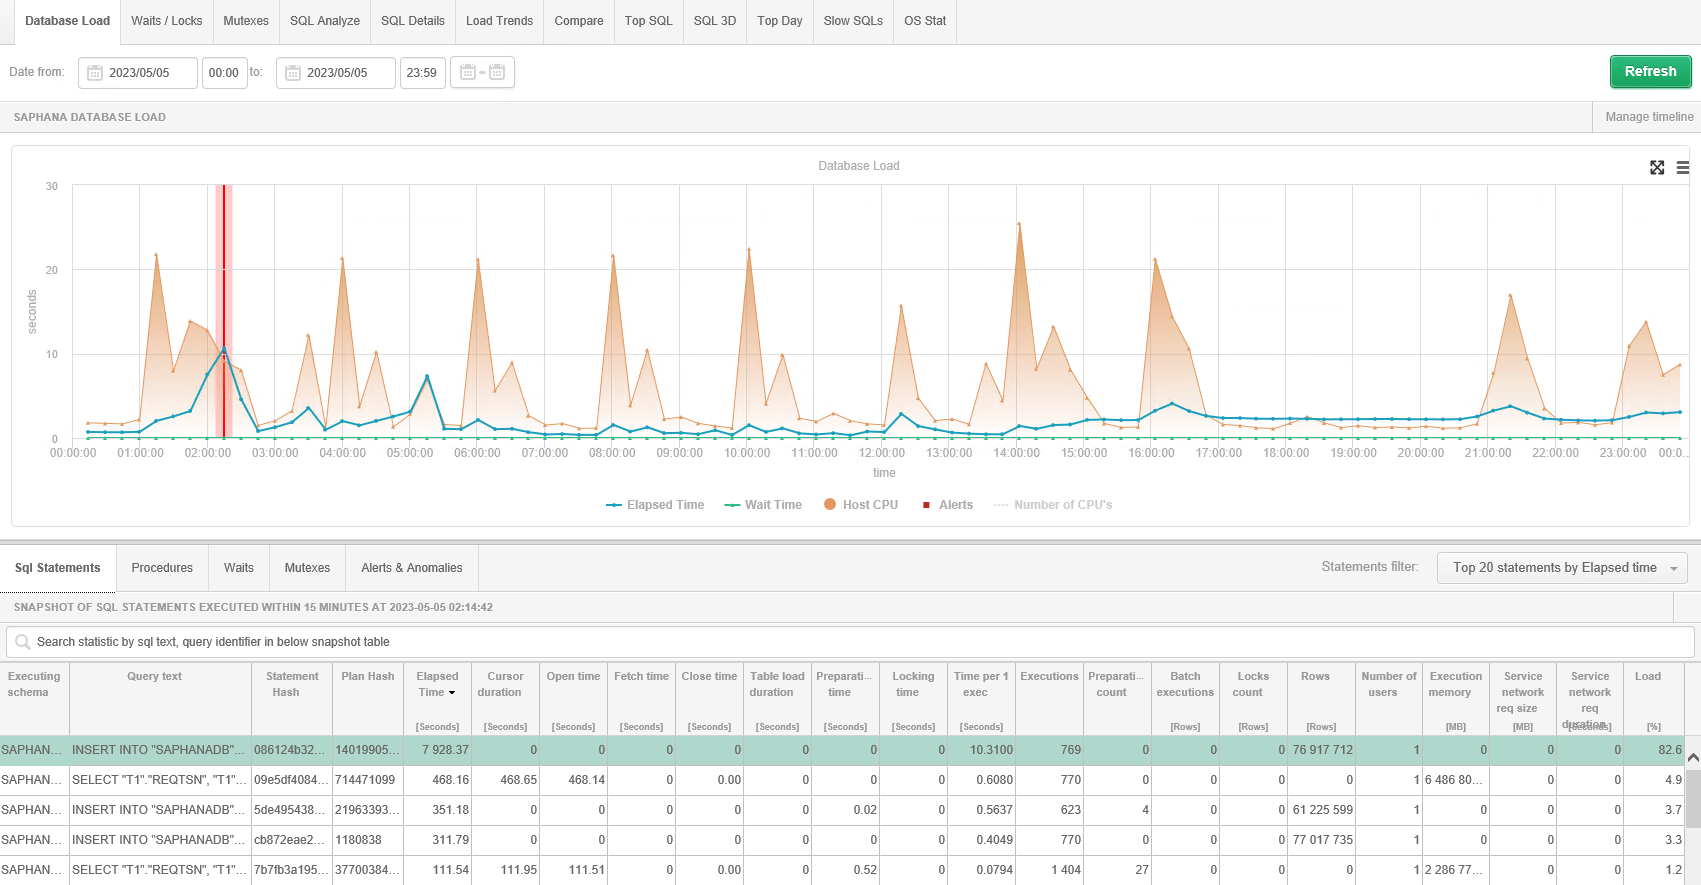
SQL Statements
By default, the application displays the most loaded queries in terms of Elapsed Time. You can change the display method - displaying the full list of queries that participated in the load. The information presented in the table with queries can be:
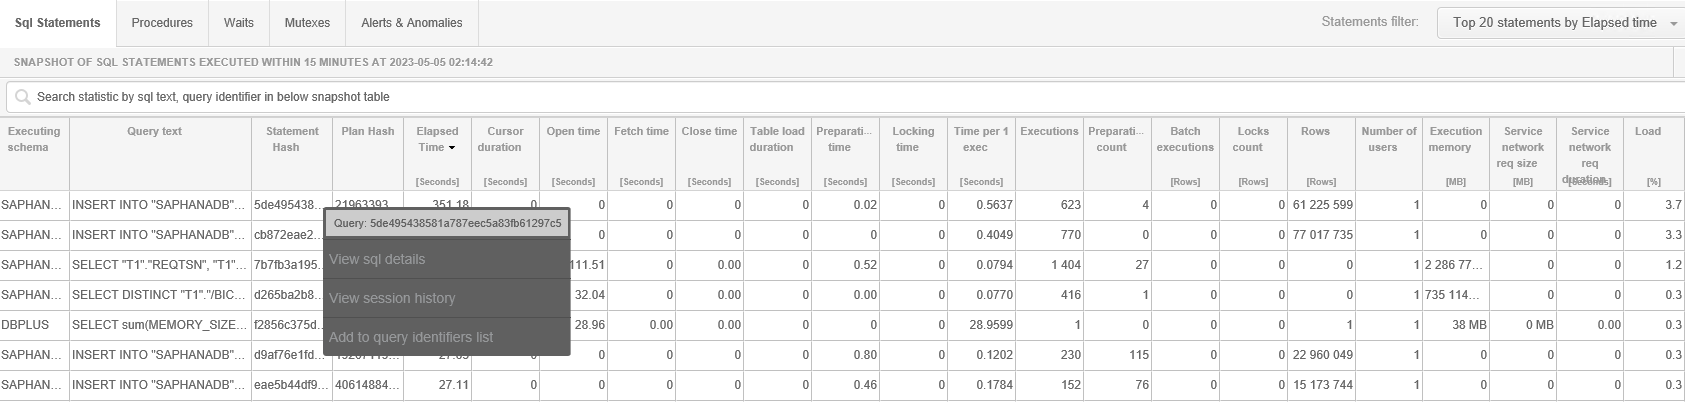
In the Statement Hash column, a [Plus] button is shown next to each row presenting the performance statistics, after clicking which a context menu is opened.
If you select SQL Details you will go to a detailed analysis of a given query.
Selecting View session history will open a session history window dedicated to the given query. The window is always opened in the context of a given day (sysdate). The user additionally has the option to apply a number of filters available so far on the session history screen. Quickly accessing the session history screen significantly speeds up the analysis of the performance of a given query, making it possible, for example, to identify the user performing the query. identification of the user performing the analyzed query.
. When you select Add to query hash list, you copy the query ID to the query list clipboard for later analysis. The clipboard is available in the lower left corner of the screen.
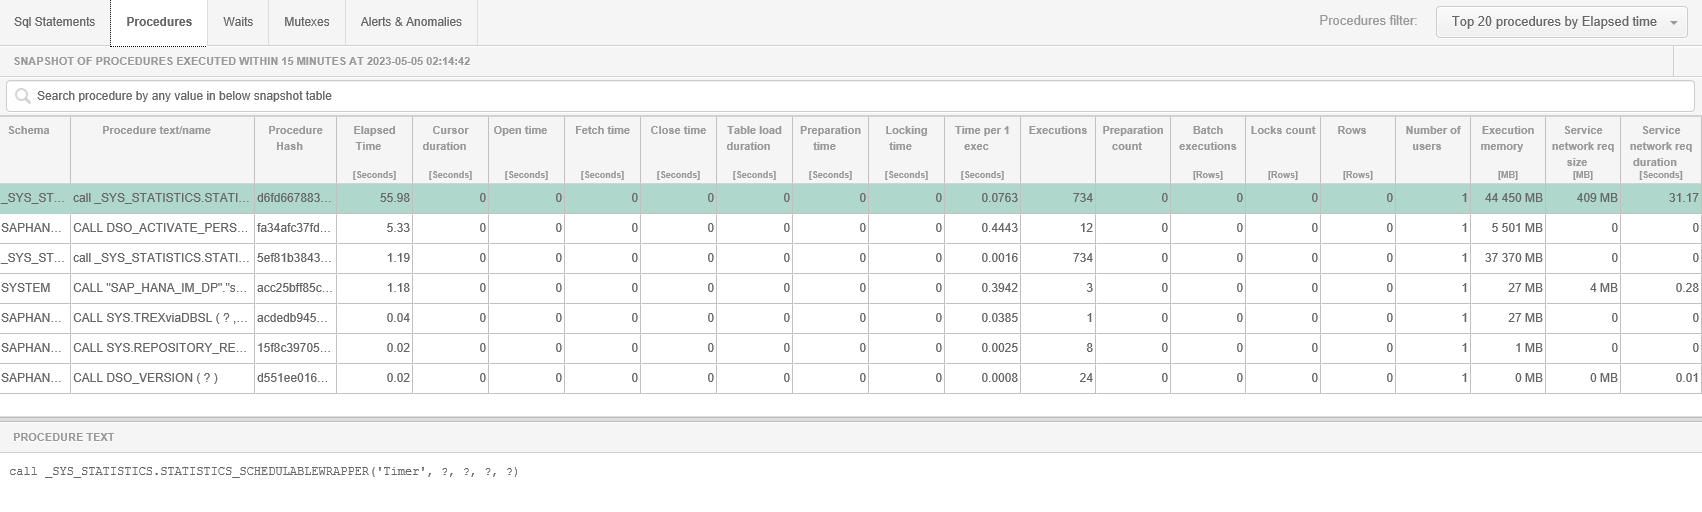
Procedures
The tab shows information about the procedures and their statistics executed at a given point in time on the database.
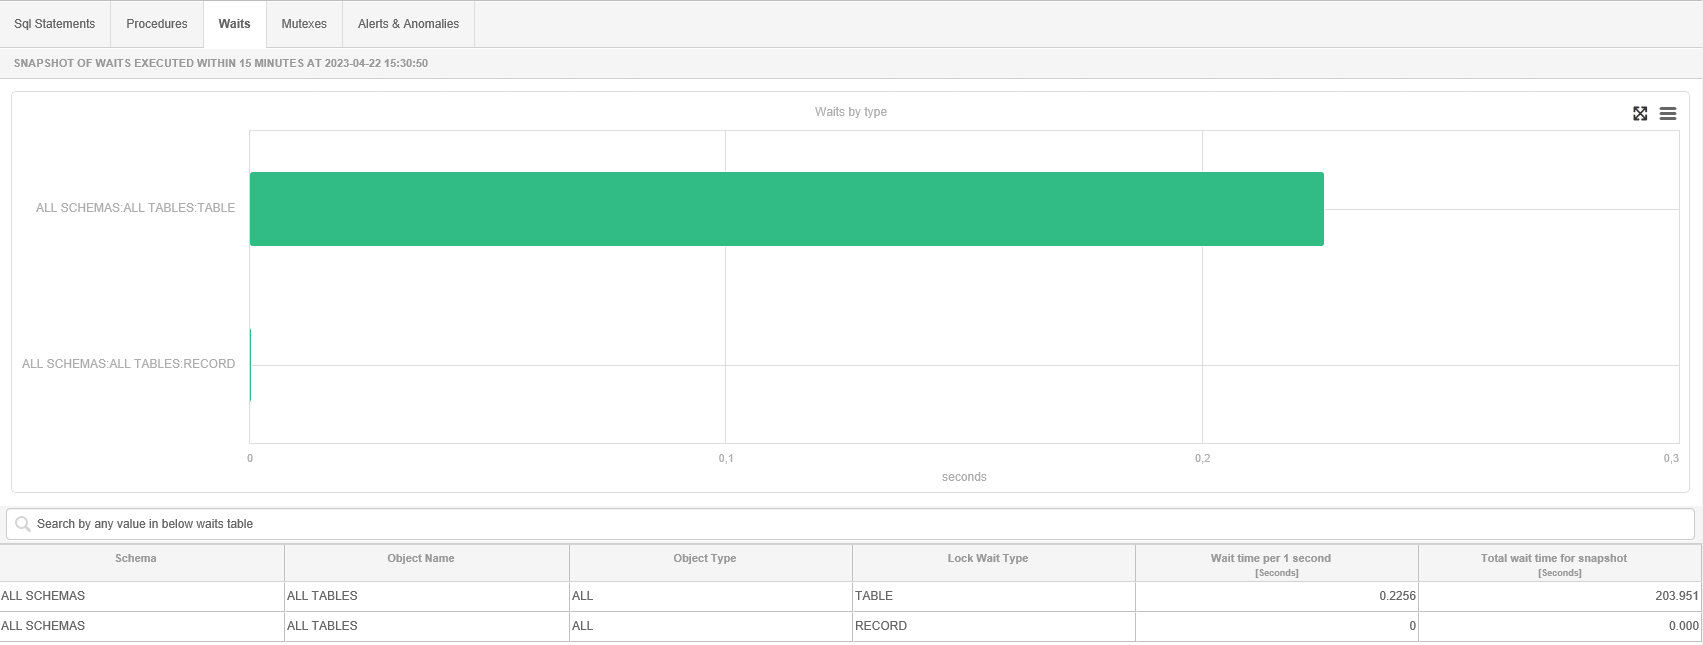
Waits
The tab shows the level of expectation for a given point in time. The graph shows the duration for each second of the selected snapshot (15 minutes time) of each type of expectation/wait that occurred at that time on the instance. In the case of the SAP HANA database, the information on the graph shows the occurrence of locks in the dnaych database.
Below the chart is a table containing information such as:
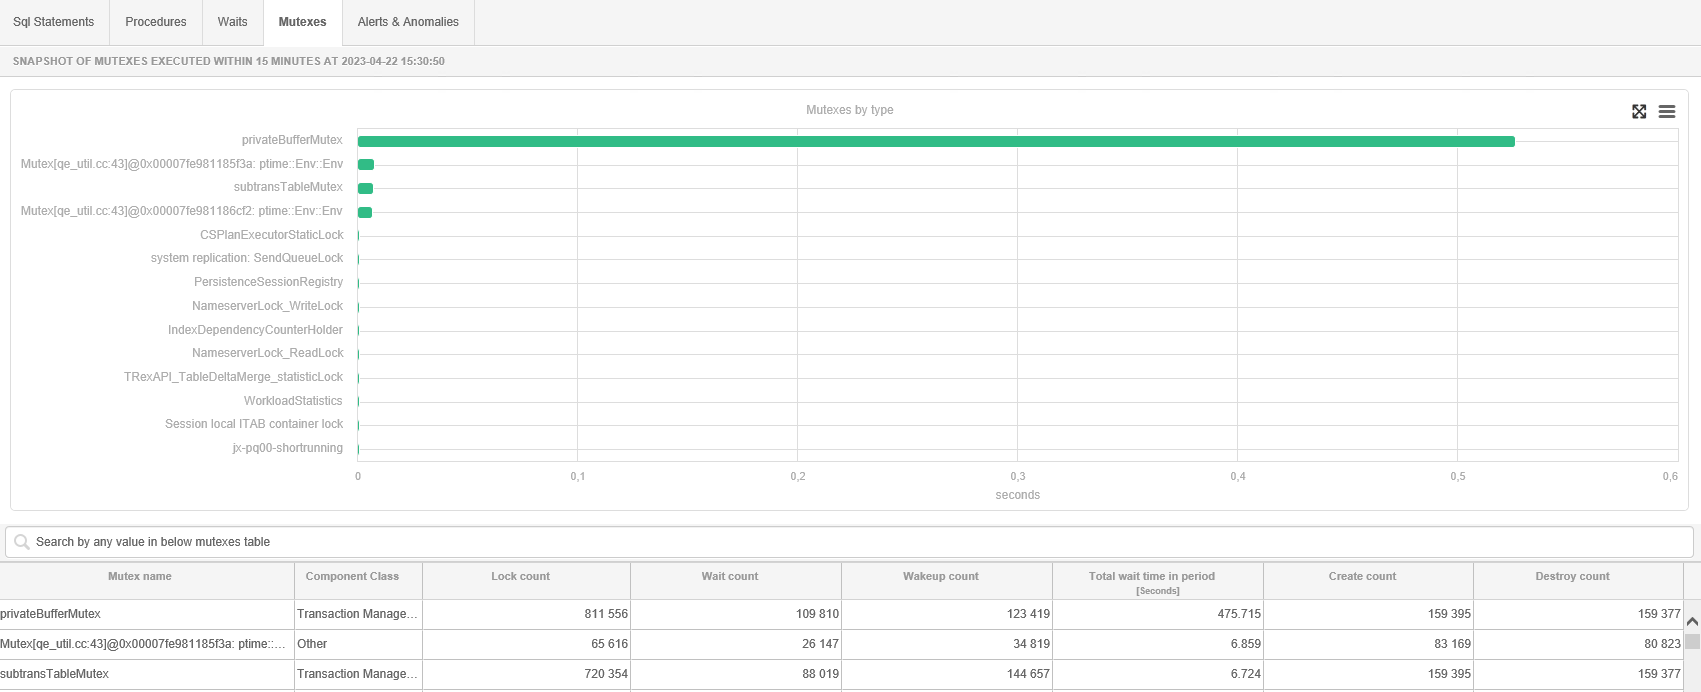
Mutexes
The tab shows information about mutexes and their statistics executed at a given point in time on the database.
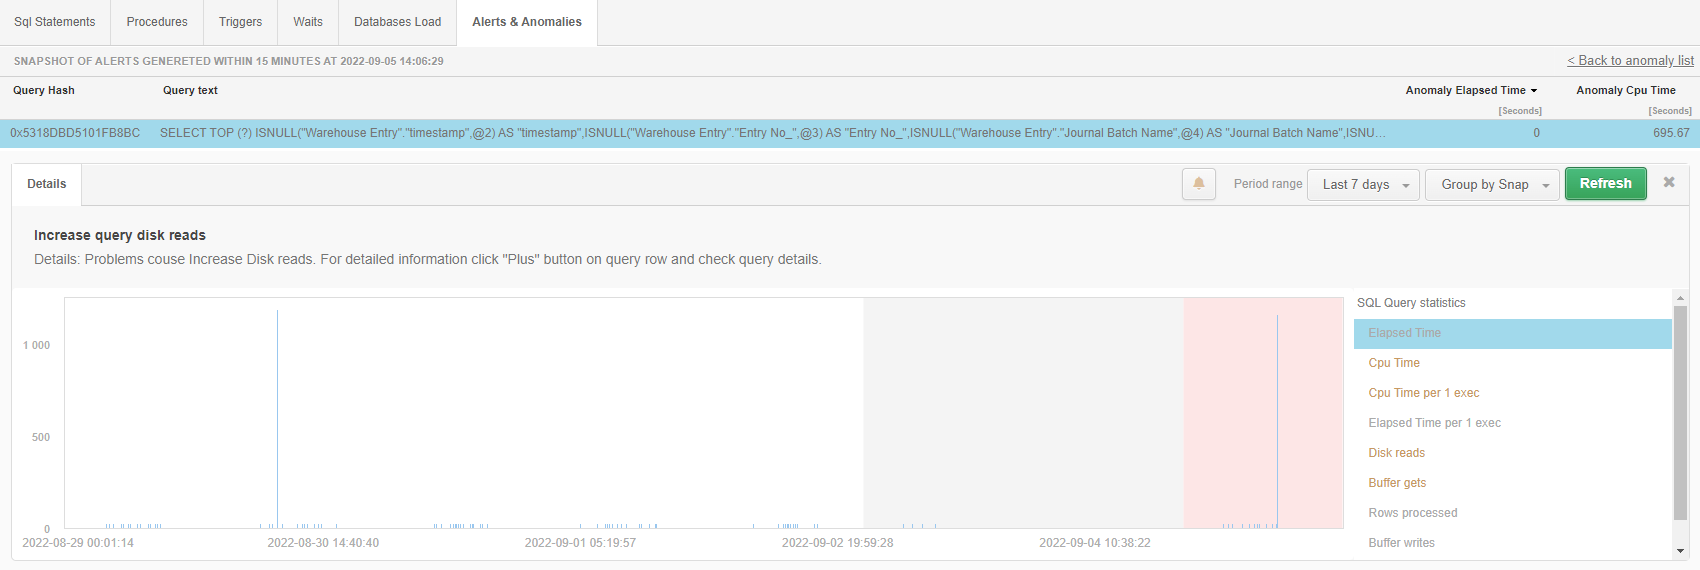
Alerts & Anomalies
Presents information about the type of performance problem that was detected in the form of an alert. Information about alerts can be viewed on the dedicated Anomaly Monitor module.